Nigeria’s oil and gas sector remains defined by asset-heavy balance sheets, reflecting the industry’s deep capital requirements and infrastructure investments.
A review of the half-year 2025 financials shows notable variations in asset composition, efficiency, and leverage among the top operators.
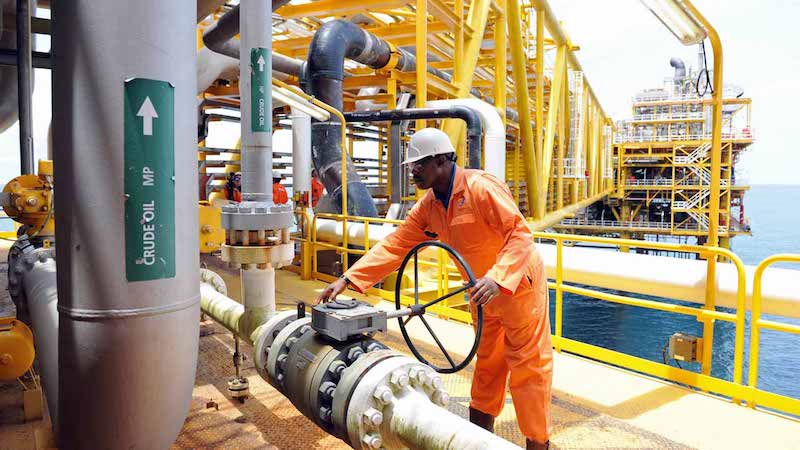
Behind every oil barrel produced or litre of petrol sold lies a web of massive assets (pipelines, rigs, refineries, and terminals).


An analysis of financial statements from leading listed oil and gas firms reveals significant differences in total assets and capital efficiency as of H1 2025.
Who holds the biggest balance sheet in Nigeria’s oil and gas sector, and what does it say about their performance? From upstream giants to downstream distributors.
Below are the top five listed oil and gas companies by their total assets.
TotalEnergies recorded a 4.6% decline in total assets to N449.47 billion in H1 2025, down from N471.12 billion in FY 2024. The contraction reflects the decrease in key assets such as property, plant, and equipment (PPE), inventories, trade receivables and cash and cash equivalents.
Its Return on Assets (ROA) of -0.01x signals a marginal loss on asset utilization during the half-year, meaning returns were slightly negative relative to the size of its asset base. However, the company’s Asset Turnover Ratio of 0.94x stands out as one of the highest among peers, indicating exceptional efficiency in generating revenue — almost 94 kobo for every N1 of assets employed. This highlights TotalEnergies’ strong retail and distribution reach within the downstream sector.
The Operating Income to Total Assets ratio of 0.02x shows modest operating profitability relative to assets, suggesting that while the company is highly efficient in generating sales, cost pressures may have compressed margins. On the financing side, a Debt-to-Asset Ratio of 0.26x indicates that about 26% of its assets are funded through debt — a balanced and manageable level for its operations. Its Equity-to-Asset Ratio of 0.13x reveals moderate shareholder funding, while the Net Debt-to-Total Assets Ratio of 0.08x suggests a mildly leveraged position, reflecting some reliance on borrowings to support operations.
However, the Cash Flow to Total Assets ratio of -0.23x points to cash flow challenges during the period, possibly tied to timing differences in receivables or inventory buildup, common in the downstream oil sector. The Property, Plant, and Equipment (PPE) to Total Assets Ratio of 0.13x indicates a light fixed-asset structure, typical for a marketing and distribution-focused company.
Its asset mix reveals a company that excels in revenue generation and operational efficiency but faces temporary profitability and liquidity headwinds. Its lean asset model and balanced leverage position it well to rebound once cost and cash flow pressures ease.


