 Follow Us on Google Discover
Nigeria’s oil and gas sector remains defined by asset-heavy balance sheets, reflecting the industry’s deep capital requirements and infrastructure investments.
A review of the half-year 2025 financials shows notable variations in asset composition, efficiency, and leverage among the top operators.
Behind every oil barrel produced or litre of petrol sold lies a web of massive assets (pipelines, rigs, refineries, and terminals).
An analysis of financial statements from leading listed oil and gas firms reveals significant differences in total assets and capital efficiency as of H1 2025.
Also Read
Who holds the biggest balance sheet in Nigeria’s oil and gas sector, and what does it say about their performance? From upstream giants to downstream distributors.
Below are the top five listed oil and gas companies by their total assets.
Conoil Plc- N117.56 billion
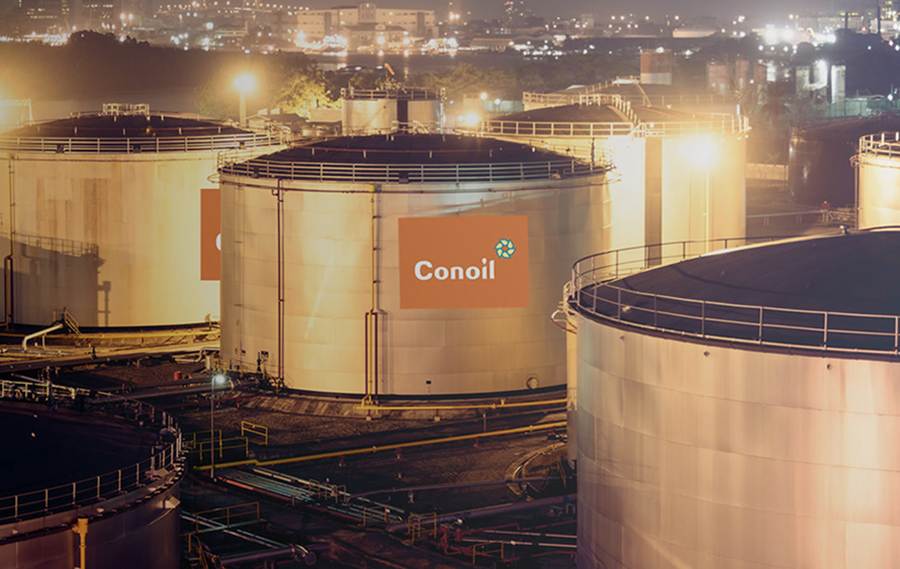
Conoil grew its total assets slightly by 2.27% to N117.56 billion in H1 2025, reflecting an increase in trade receivables from its marketing operations and cash and bank balances.
The company’s Return on Assets (ROA) of 0.35x is exceptionally strong, showing that for every N1 of assets, Conoil generated 35 kobo in net profit. This underscores its impressive operational profitability and efficient asset use. Similarly, an Asset Turnover Ratio of 1.22x indicates high efficiency in revenue generation, meaning the company generated more than its total asset value in sales during the period.
However, the Operating Income to Total Assets ratio of 0.01x suggests thin operating margins, implying that profitability is largely driven by non-operating gains or efficient cost management rather than core operating income.
On the balance sheet side, the Debt-to-Asset Ratio of 0.18x shows a conservative capital structure, with only 18% of assets financed through debt. This low leverage reflects prudent financial management. The Equity-to-Asset Ratio of 0.34x indicates strong shareholder funding, and the Net Debt-to-Total Assets Ratio of 0.12x confirms limited dependence on external borrowings — a positive signal for solvency and risk profile.
Cash generation is healthy, with Cash Flow to Total Assets at 0.11x, showing that operating cash inflows adequately support the company’s asset base. Meanwhile, the PPE-to-Total Assets ratio of 0.03x highlights its light asset model typical of downstream marketers focused on distribution and retail rather than production.
Conoil’s metrics portray a well-run downstream operator with outstanding profitability, efficient asset utilization, and a conservative debt profile.
TotalEnergies Marketing Nigeria Plc – N449.47 billion
TotalEnergies recorded a 4.6% decline in total assets to N449.47 billion in H1 2025, down from N471.12 billion in FY 2024. The contraction reflects the decrease in key assets such as property, plant, and equipment (PPE), inventories, trade receivables and cash and cash equivalents.
Its Return on Assets (ROA) of -0.01x signals a marginal loss on asset utilization during the half-year, meaning returns were slightly negative relative to the size of its asset base. However, the company’s Asset Turnover Ratio of 0.94x stands out as one of the highest among peers, indicating exceptional efficiency in generating revenue — almost 94 kobo for every N1 of assets employed. This highlights TotalEnergies’ strong retail and distribution reach within the downstream sector.
The Operating Income to Total Assets ratio of 0.02x shows modest operating profitability relative to assets, suggesting that while the company is highly efficient in generating sales, cost pressures may have compressed margins. On the financing side, a Debt-to-Asset Ratio of 0.26x indicates that about 26% of its assets are funded through debt — a balanced and manageable level for its operations. Its Equity-to-Asset Ratio of 0.13x reveals moderate shareholder funding, while the Net Debt-to-Total Assets Ratio of 0.08x suggests a mildly leveraged position, reflecting some reliance on borrowings to support operations.
However, the Cash Flow to Total Assets ratio of -0.23x points to cash flow challenges during the period, possibly tied to timing differences in receivables or inventory buildup, common in the downstream oil sector. The Property, Plant, and Equipment (PPE) to Total Assets Ratio of 0.13x indicates a light fixed-asset structure, typical for a marketing and distribution-focused company.
Its asset mix reveals a company that excels in revenue generation and operational efficiency but faces temporary profitability and liquidity headwinds. Its lean asset model and balanced leverage position it well to rebound once cost and cash flow pressures ease.
Aradel Holdings Plc – N1.81 trillion
Aradel Holdings Plc maintained a steady growth trajectory in H1 2025, with total assets rising by 3.48% from N1.75 trillion at year-end 2024 to N1.81 trillion. This modest expansion reflects an increase in investments in associates and financial assets.
The company’s Return on Assets (ROA) stood at 0.08x, suggesting Aradel generates N8 for every N100 invested in assets, a strong indication of efficient asset utilization compared to most peers in the industry. Its Asset Turnover Ratio of 0.20x further reinforces this efficiency, showing that each N1 of assets produced 20 kobo in revenue during the period. Combined with an Operating Income to Total Assets ratio of 0.07x, the company demonstrates that its assets are not just productive but also profit-generating.
Aradel’s Debt-to-Asset Ratio of 0.08x confirms its conservative leverage strategy as only 8% of its assets are financed by debt. In contrast, an Equity-to-Asset Ratio of 0.80x reveals that shareholders’ funds account for the majority of its asset financing, reflecting a solid equity cushion. Interestingly, the Net Debt-to-Total Assets Ratio of -0.12x implies that Aradel holds more cash than debt, meaning it is in a net cash position, a sign of strong liquidity and prudent financial management.
Meanwhile, its Cash Flow to Total Assets Ratio of 0.08x indicates healthy internal cash generation relative to its asset base, further reinforcing balance sheet strength. The PPE-to-Total Assets ratio of 0.37x indicates significant, though balanced, investment in physical assets.
Aradel’s asset profile reflects a company that balances growth and financial discipline.
Oando Plc – N6.76 trillion

Oando Plc’s total assets rose by 5.09%, from N6.43 trillion in FY 2024 to N6.76 trillion in H1 2025, reflecting increase in inventories, receivables, short-term investments and deferred income tax assets.
The company’s Return on Assets (ROA) of 0.96% suggests marginal profitability relative to its large asset base, reflecting ongoing challenges in translating assets into earnings.
With an asset turnover ratio of 0.25x, Oando generates 25 kobo in revenue for every N1 of assets, a fair level of efficiency within the oil and gas sector. However, an operating income-to-total assets ratio of -0.02x shows that operating results remain negative, pointing to underlying pressure on profitability.
The company’s debt-to-asset ratio of 0.47x highlights that nearly half of its total assets are financed through borrowings, one of the highest in the sector. Meanwhile, its equity-to-asset ratio of -0.05x confirms a negative equity position, meaning liabilities exceed shareholders’ funds. This reflects a distressed capital structure.
Oando’s net debt-to-asset ratio of 0.44x further emphasizes heavy reliance on borrowings, while cash flow-to-assets of -0.05x signals weak cash generation capacity relative to its asset size. Its PPE-to-Total Assets ratio of 0.47x shows a sizable portion of assets in physical oil and gas infrastructure, emphasizing its long-term capital commitments.
Oando remains an asset-rich but highly leveraged player, balancing heavy infrastructure exposure with the need for operational turnaround.
Seplat Energy Plc – N9.36 trillion
Seplat Energy Plc reported total assets of N9.36 trillion in the first half of 2025, reflecting a 4.74% decline from N9.82 trillion at the end of 2024. This contraction is due to a decline in inventories, cash and its property, plant and equipment.
The company’s Return on Assets (ROA) of 0.4% shows modest profitability relative to its asset base, typical for upstream operators in a high-cost environment. Its asset turnover ratio of 0.23x indicates that Seplat generates 23 kobo in revenue for every N1 invested in assets, demonstrating efficient utilization given its capital-intensive operations.
Seplat’s debt-to-asset ratio of 0.18x implies that only 18% of its total assets are financed through borrowings, showing a conservative leverage structure. Complementing this, its equity-to-asset ratio of 0.30x reflects a strong equity cushion that reinforces balance sheet stability.
The net debt-to-assets ratio of 0.11x confirms that borrowings remain well covered by total assets, while cash flow-to-assets of 0.08x indicates healthy operational liquidity and consistent cash generation. Meanwhile, a PPE-to-Total Assets ratio of 0.54x confirms Seplat’s heavy investment in fixed assets, underscoring its deep upstream exposure.
Seplat stands as a stable, asset-heavy operator with manageable debt and consistent, if modest, returns on its large asset base.