 Follow Us on Google Discover
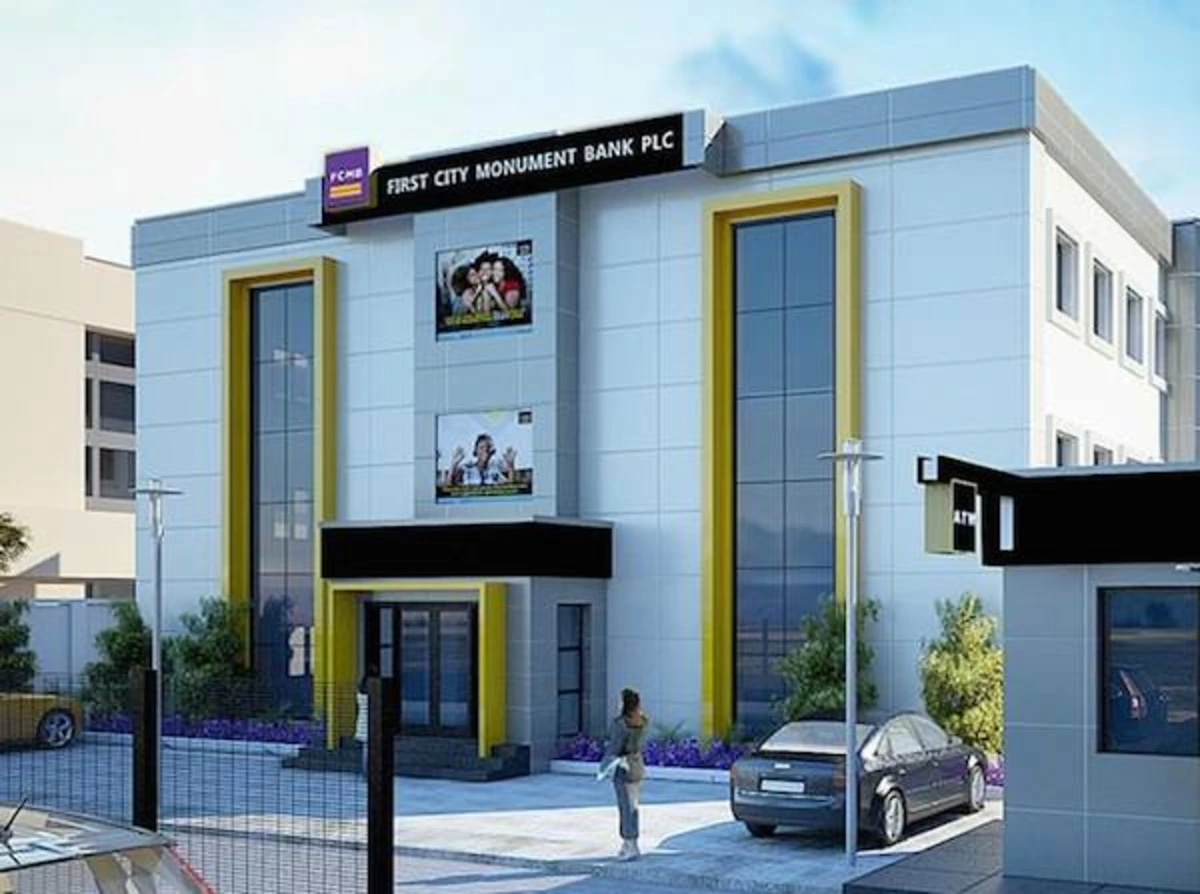
FCMB Group Plc reported a 102.8% increase in pre-tax profit to N272.77 billion for the nine months ended September 30, 2026, compared with N134.50 billion in the corresponding period of 2025.
The performance came as gross earnings crossed the N1 trillion mark in the nine-month period, while profit after tax increased by 85.7% to N232.91 billion.
According to the interim financial statements, in the third quarter of 2026, pre-tax profit rose by 108.5% to N115.47 billion, compared with N55.37 billion in Q3 2025.
The Q3 result beat the Group’s pre-tax profit forecast of N98.16 billion by 17.63%, exceeding expectations by N17.31 billion.
Also Read
Key Highlights
- Gross earnings: N1.00 trillion (Up 21.0% YoY from N828.13 billion).
- Net interest income: N534.18 billion (Up 52.3% YoY from N350.83 billion).
- Net fee and commission income: N81.91 billion (Up 45.8% YoY from N56.19 billion).
- Operating profit: N272.63 billion (Up 103.1% YoY from N134.20 billion).
- Pre-tax profit: N272.77 billion (Up 102.8% YoY from N134.50 billion).
- Profit after tax: N232.91 billion (Up 85.7% YoY from N125.45 billion).
- Earnings per share: N4.59 (Up 22.7% YoY from N3.74).
- Total assets: N8.37 trillion (Up 9.7% from N7.63 trillion).
- Cash and cash equivalents: N1.83 trillion (Up 40.5% from N1.30 trillion).
- Customer deposits: N4.73 trillion (Up 7.1% from N4.42 trillion).
- Loans and advances: N2.17 trillion (Down 8.3% from N2.37 trillion).
- Total equity: N1.24 trillion (Up 47.8% from N836.41 billion).
Management Commentary
Group Chief Executive Officer Ladi Balogun attributed the nine-month performance to ongoing digital transformation, business portfolio rebalancing, and improvements in operating efficiency.
- “Our nine-month results reflect the dedication of our people to building a more efficient engine that can scale with stronger unit economics,” Balogun stated.
On the outlook for the final quarter, he added:
- “We expect continued earnings momentum in the fourth quarter, supported by lower operating expenses following the full recognition of the 2026 AMCON levy within the nine-month period, alongside a seasonal uplift in digital lending and payments activity.”
Balogun also expressed confidence in the Group’s profitability, stating that with nine-month return on equity at 30%, management expects full-year return on equity to be materially above its earlier guidance of 25%.
Driving the numbers
FCMB Group’s nine-month earnings performance was driven largely by improved interest income and a reduction in funding costs, which supported stronger profitability despite higher impairment charges and operating expenses.
Interest income increased by 23.4% to N906.03 billion from N734.11 billion in the corresponding period of 2025.
According to the company’s release, the increase was supported by a 10.7% expansion in earning assets to N5.43 trillion from N4.90 trillion.
At the same time, interest expenses declined by 3.0% to N371.85 billion from N383.28 billion, helping net interest income increase by 52.3% to N534.18 billion.
This improvement reflected a shift towards cheaper funding sources, as current and savings account deposits increased by 24.4% to N3.60 trillion from N2.89 trillion in December 2025.
Consequently, the proportion of low-cost deposits increased to 76% from 65.4%, contributing to an improvement in net interest margin to 12.3% from 10.1% in the corresponding nine-month period.
Beyond interest income, net fee and commission income rose by 45.8% to N81.91 billion from N56.19 billion, providing additional support to operating earnings.
The Group’s digital businesses, comprising payments, lending and wealth management, generated N142.5 billion in revenue, compared with N113.6 billion in the prior-year period.
This represented growth of 25.4%, with digital businesses contributing 14.2% of gross earnings.
In terms of divisional profitability, the Banking Group remained the largest contributor, reporting pre-tax profit of N216.9 billion, representing 80% of Group pre-tax profit and a 94% year-on-year increase.
The non-banking businesses and holding company collectively contributed N55.9 billion, accounting for the remaining 20%, with profits rising by 147% year-on-year.
The improvement across the divisions indicates that earnings growth was not restricted to the Group’s core banking operations, although banking remained the principal profit contributor.
Costs
On the cost side, operating expenses increased by 12.5% to N268.9 billion from N239 billion, according to management’s earnings release.
However, the increase was considerably slower than the growth in net interest income, supporting operating leverage.
The Group’s cost-to-income ratio consequently improved to 43.5% from 55.5% in the corresponding period of 2025.
Personnel expenses increased to N88.00 billion from N71.87 billion, while general and administrative expenses rose to N102.65 billion from N95.38 billion.
Credit impairment remained a significant cost pressure, with net impairment losses increasing to N76.81 billion from N57.12 billion.
Management attributed the higher nine-month impairment charge to a Stage 2 loan portfolio clean-up undertaken in the second quarter.
However, the third quarter benefited from a N9.12 billion net impairment write-back, compared with an impairment charge of N20.90 billion in Q3 2025.
This was a notable contributor to the strong third-quarter pre-tax profit of N115.47 billion.
Balance sheet and asset quality
Nevertheless, asset quality warrants attention, as the Nigerian banking subsidiary’s IFRS non-performing loan ratio increased to 6.4% from 4.7% in June 2026.
- Management linked the increase to a 13% reduction in the loan book during the third quarter and new Stage 3 loan classifications.
- The Group’s balance sheet also reflected a shift in asset composition.
- Loans and advances declined by 8.3% to N2.17 trillion, while investment securities increased to N2.49 trillion from N2.04 trillion at December 2025.
Management explained that significant corporate loan repayments more than offset growth of over 20% in digitally originated retail and SME lending, which reached N315 billion.
The Group’s equity position strengthened significantly, supported by retained earnings and an approximately N227 billion capital injection during the first quarter of 2026.
This lifted the Group’s capital adequacy ratio to 24.6% at the end of September 2026.
Overall, the nine-month results show stronger earnings generation, improved funding efficiency and greater profitability, although rising impairment charges and the deterioration in the reported non-performing loan ratio remain important indicators to monitor.
Market performance
FCMB Group Plc’s share price closed at N10.95 on Friday, November 20, 2026, the day the Group announced its nine-month financial results, representing a 0.5% gain from the previous closing price of N10.90.
Despite the positive movement, the stock has declined by 9.13% from its opening price of N12.05 at the beginning of 2026.