Nigeria’s oil and gas sector remains defined by asset-heavy balance sheets, reflecting the industry’s deep capital requirements and infrastructure investments.
A review of the half-year 2025 financials shows notable variations in asset composition, efficiency, and leverage among the top operators.
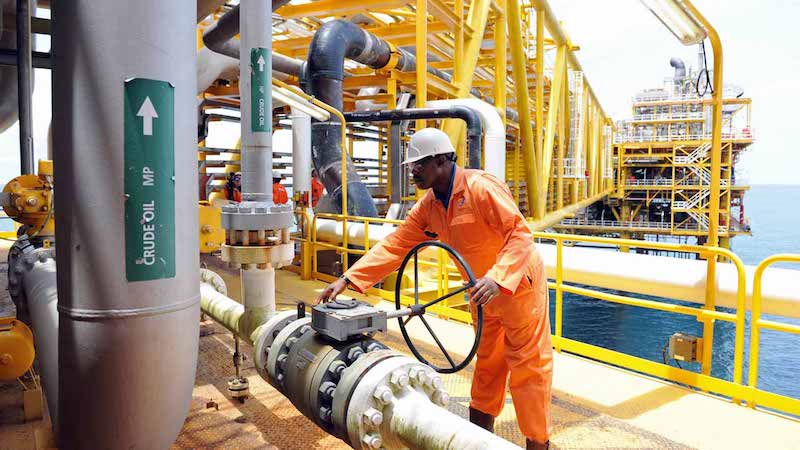
Behind every oil barrel produced or litre of petrol sold lies a web of massive assets (pipelines, rigs, refineries, and terminals).


An analysis of financial statements from leading listed oil and gas firms reveals significant differences in total assets and capital efficiency as of H1 2025.
Who holds the biggest balance sheet in Nigeria’s oil and gas sector, and what does it say about their performance? From upstream giants to downstream distributors.
Below are the top five listed oil and gas companies by their total assets.

Oando Plc’s total assets rose by 5.09%, from N6.43 trillion in FY 2024 to N6.76 trillion in H1 2025, reflecting increase in inventories, receivables, short-term investments and deferred income tax assets.
The company’s Return on Assets (ROA) of 0.96% suggests marginal profitability relative to its large asset base, reflecting ongoing challenges in translating assets into earnings.
With an asset turnover ratio of 0.25x, Oando generates 25 kobo in revenue for every N1 of assets, a fair level of efficiency within the oil and gas sector. However, an operating income-to-total assets ratio of -0.02x shows that operating results remain negative, pointing to underlying pressure on profitability.
The company’s debt-to-asset ratio of 0.47x highlights that nearly half of its total assets are financed through borrowings, one of the highest in the sector. Meanwhile, its equity-to-asset ratio of -0.05x confirms a negative equity position, meaning liabilities exceed shareholders’ funds. This reflects a distressed capital structure.
Oando’s net debt-to-asset ratio of 0.44x further emphasizes heavy reliance on borrowings, while cash flow-to-assets of -0.05x signals weak cash generation capacity relative to its asset size. Its PPE-to-Total Assets ratio of 0.47x shows a sizable portion of assets in physical oil and gas infrastructure, emphasizing its long-term capital commitments.
Oando remains an asset-rich but highly leveraged player, balancing heavy infrastructure exposure with the need for operational turnaround.


