
In his book, 7 Habits of Highly Effective People, Stephen Covey noted that effective people have the habit of being proactive, they begin with the end in mind, put first things first, think win-win, they seek first to understand, then to be understood and they synergize and finally they sharpen the saw.
In the same way, highly effective investors have their own habits which may be 7 or more. If you doubt me, ask Warren Buffet. One of such habit is that they track stocks that are making the greatest percentage gains and of course, greatest percentage losses. By so doing they are able to identify stocks that are making large upside moves such that investing in them enables the investor to catch in on the massive volatility that comes with such moves. Investing in such stocks could make you big money. Here are some such stocks:
C&I Leasing Plc
C&I Leasing PLC engages in the business of operational leases, finance leases and offshore marine support and other ancillary services in Nigeria. Its services include C & I Marine, C & I Outsourcing, SDS Training Services and Fleet Management Solutions. The fundamentals look good and the technicals seem to be positive as well. The stocks current price of N3.00 per share is above its 10_week, 20_week and 5-Week moving averages and the stock has recorded an alpha of 165 and it has a negative beta and correlation with respect to the stock market, meaning that it moves the opposite way from the market.


Fundamentals:
| P/E Ratio: 3.98 | Price to Book:.513 | Price to Sale: .24 |
| YTD Return:132% | 1 Yr.- Return: 148% | YTD (2017): 158% |
| 5_Week MA: 2.75 | 10_Week MA: 2.61 | 20_Week MA: 2.2 |
| Alpha 164.75 | Beta -1.26 | Correlation to the market -0.31 |
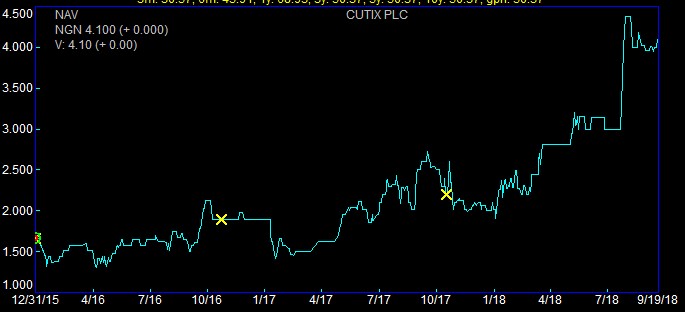
Cutix Plc
Cutix Plc is engaged in the manufacturing and marketing of electrical, automobile and telecommunication wires, cables and related. The company recorded a Q2 profit margin of 8.44%.
Fundamentals:
| P/E Ratio: 7.99 | Price to Book:.2.44 | Price to Sale: .71 |
| YTD Return:104% | 1 Yr.- Return: 75.25% | YTD (2017): 16% |
| 5_Week MA: 4.03 | 10_Week MA: 3.95 | 20_Week MA: 3.51 |
| Alpha 76.5 | Beta -0.15 | Correlation to the market: 0.21 |
| EPS: .51 | Dividend Yield 4.78% | 1_Week MA: 4.08 |
NEM Insurance Plc
NEM Insurance Plc is one of the oldest surviving insurance companies in Nigeria, having been in business since 1948. Though the company has not been struggling for some time, the recent acquisition of its shares at N4 per share by Eaton Acquisition Ltd is an indication of undervaluation. In 2017 fiscal year the company grew its premium by 24.7% while net premium increased by 15.2%. Though its current price of N3.00 per share is below its 1-week, 5-week and 10-week moving average, a reversal may be on the horizon soon.

NEM Fundamental/Technical Indicators:
| P/E Ratio: 5.66 | Price to Book: 1.63 | Price to Sale: 1.41 |
| YTD Return:92.93% | 1 Yr.- Return: 165% | YTD (2017): 70.49% |
| 5_Week MA: 3.1 | 10_Week MA: 3.03 | 20_Week MA: 2.93 |
| Alpha 189.74 | Beta 0.59 | Correlation to the market: 0.18 |
| EPS: .53 | Dividend Yield 2.67% | 1_Week MA: 3.08 |
Unity Bank
Unity Bank is a product of a merger nine banks and offers a wide range of banking services in Nigeria. The bank is positioning itself for some great performance in 2019 having sold about N400 billion worth of bad loans to Frontier Capital Asset Ltd. The bank is also one of the banks appointed by the CBN to administer an N80 billion credit facility for over 300,000 rice farmers, an activity that is poised to increase the bank’s revenue.
Although the bank suffered huge price crash in February when the price went as high N1.9, fundamental and technical indicators seem to favour the bank which has generated an alpha of 237 so far in 2018 and has a low correlation with the market. The current price of N0.97 indicates a crossing above its 1-week, 5-week, 10-week and 20-week moving averages which could indicate that it is time to jump in.

Unity Bank Fundamentals/Technical Indicators:
| P/E Ratio: 9.3 | Price to Book: 0.13 | Price to Sale: 0.1 |
| YTD Return:83% | 1 Yr.- Return: 84.6% | YTD (2017): 70.49% |
| 5_Week MA: .80 | 10_Week MA: .85 | 20_Week MA: .91 |
| Alpha 237.37 | Beta 1.14 | Correlation to the market: 0.13 |
| EPS: .10 | Dividend Yield | 1_Week MA: .91 |


