Key Highlights
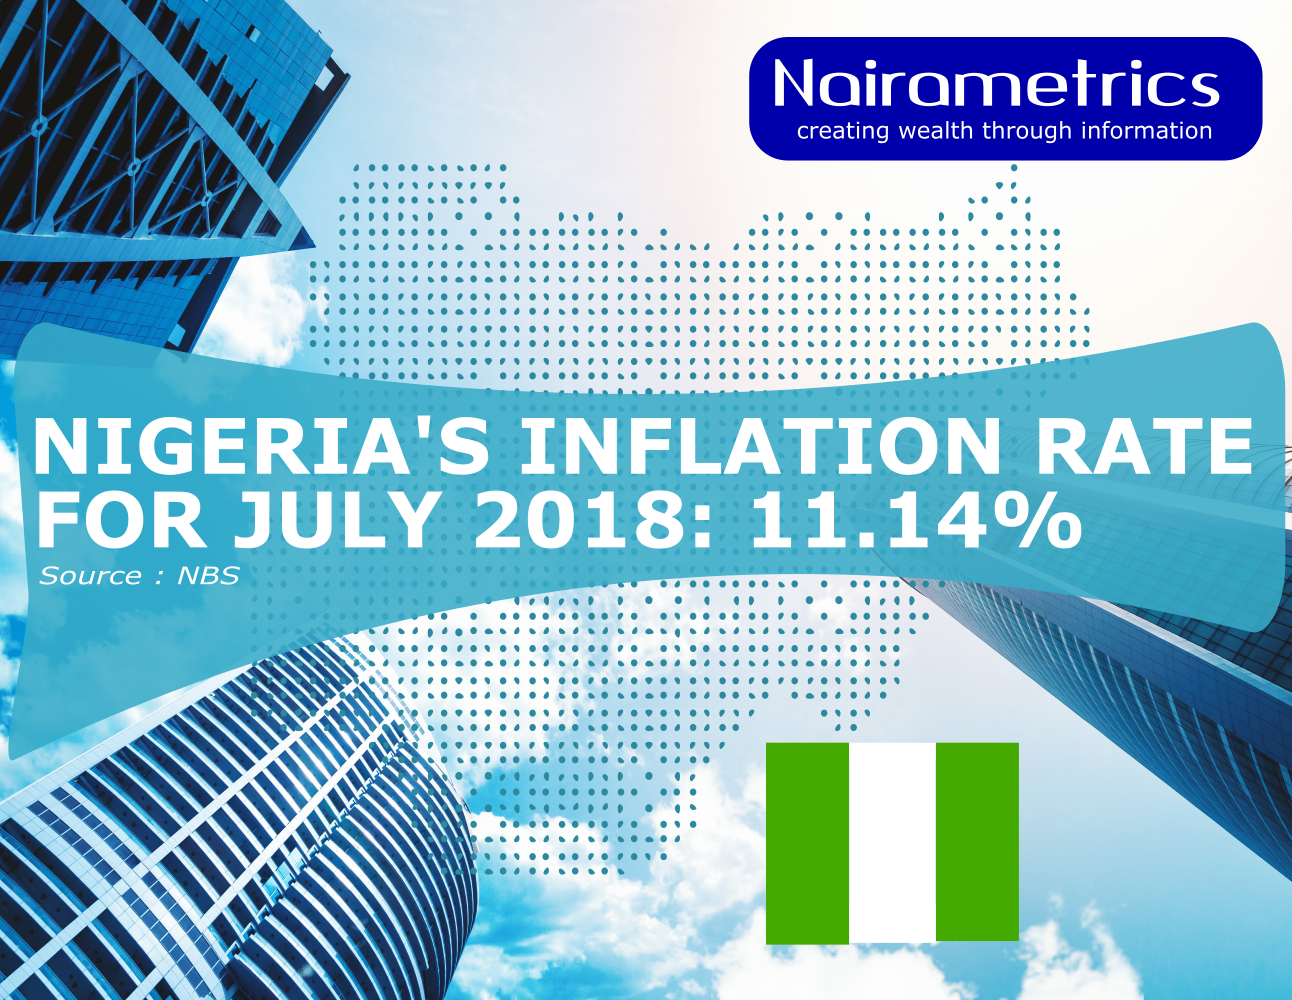
- Inflation rate stood at 11.14% in July.
- Inflation rate reduces by 0.09% from June.
- Inflation rate increased by 1.13% on month-on-month basis.
- Food inflation stood at 12.85% in July.
- Core Inflation stood at 10.2% in July.
The National Bureau of Statistics (NBS), on Monday released the Consumer Price Index (CPI) for July 2018. The CPI measures the average change over time in prices of goods and services consumed by people for day-to-day living.
The report shows inflation increased by 11.14% (year-on-year) in July 2018 which is 0.09% less than the recorded rate in June, 2018 (11.23%). This reduction is the eighteenth consecutive month inflation rate has been dropping since January, 2017.
Core Inflation
According to the NBS report, core inflation stood at 10.2% and decreased by 0.2% in the month of July from the 10.4% recorded in June. On a month on basis, it rose by 0.81% in the period under review. It was down by 0.22% when compared with 1.03% recorded in June.
However, the percentage change in the average composite CPI for the twelve-month period ending July, 2018 over the average of the CPI for the previous twelve-month period was 11.48%, which is a reduction of 0.17% from 11.65% recorded in June.
Food Inflation
The Composite Food Index rose by 12.85%, during the period under review, compared to 12.98% in June 2018. The figure shows food inflation has been declining year on year for the tenth consecutive month. The reduction was caused by the increase in price of potatoes, yam and other tubers, fish, bread and cereals, Oil and fats, vegetables and fruits.
Also, on a month-on-month basis, the Food sub-index increased by 1.40% in the month of July 2018, it went down by 0.17% from 1.57% that was recorded in the previous month of June.
The CPI report also shows that the average annual rate of change of the Food sub-index for the twelve-month period ending July 2018 over the previous twelve-month average was 17.10%, which is a reduction of 0.65% from the average annual rate of change recorded in the month of June (17.75%).
Urban Inflation
Meanwhile, the report equally shows that there is a 11.66% reduction in the urban inflation rate (year-on-year) in July 2018 from 11.68% recorded in the previous month of June 2018. The rural inflation rate remained unchanged, thus, standing at the same 10.83% recorded in the previous month of June 2018.
In the same vein, the Urban Index rose by 1.23% in July 2018 from 1.24% recorded in June, which shows a reduction of 0.01 on a month-on-month basis. For Rural Index, it also rose by 1.18%, from the recorded figure of 1.23% in the previous month of June.
The corresponding 12-month year-on-year rural inflation rate in the period under review is 13.64% compared to 14.08% in June 2018 while the corresponding urban index was 14.33% in July which is less than 14.71% reported in June, 2018.
All Items Inflation (states)
Meanwhile, during the month under review, Kebbi State recorded the highest all-items-inflation with a figure of 13.43%. Rivers State (13.09%) and Kaduna State (13.01%) followed in that order, while Plateau State (8.82%) recorded the slowest rise in price during the period. Ogun followed with 8.86% while Kwara recorded 9.63% on a year-on-year all item basis in July, 2018.
Implication
For investors, falling inflation means lower yields on treasury bills and other government securities. For select borrowers, the drop in inflation, in theory, should lead to lower rates.
[wpdatachart id=249]


