 Follow Us on Google Discover
Debt levels among Nigeria’s listed corporates showed mixed patterns in the first half of 2025.
Some companies aggressively expanded leverage to fund growth and operations, while others reduced borrowings in response to margin pressures and higher finance costs.
Nigeria’s corporate debt landscape in H1 2025 reveals a sharp divergence between aggressive borrowing by some firms and strategic deleveraging by others.
Total borrowings across key listed companies highlight both sectoral pressures and growth-driven capital deployment.
Other News
Oil and gas operators like Oando Plc and Seplat Energy Plc expanded their debt significantly to fund upstream projects and restructuring, while Dangote Cement maintained high leverage to support capacity expansion.
In contrast, consumer-facing giants like Nigerian Breweries and Nestlé Nigeria scaled back borrowings to preserve margins amid inflationary and foreign-exchange headwinds.
The debt ratios provide further insight: negative equity positions at Oando, Nestlé, and MTN Nigeria flag balance sheet risks despite strong or improving operating cash flows, while firms like BUA Cement, Transcorp, and Beta Plc display disciplined leverage and robust interest coverage.
This mix of aggressive borrowing, conservative funding strategies, and balance-sheet recalibration underscores the varied approaches Nigerian corporates are taking to navigate volatile macroeconomic conditions, high interest rates, and capital-intensive growth plans.
Below is a breakdown of each company’s debt position, growth trend, and structure.
Beta Glass Plc

Beta Plc trimmed its total borrowings slightly by 4.08% YoY, to N34.77 billion from N36.25 billion.
- Current debt: N5.59 billion
- Non-current debt: N29.18 billion
Beta Plc stands out as one of the strongest financial profiles in this group. By the first half of 2025, the company had total borrowings of N34.77 billion, offset by N12.40 billion in cash and cash equivalents, resulting in a net debt of N22.37 billion, modest when compared with its operational scale.
Its debt-to-equity ratio of 0.43x and debt-to-capital ratio of 0.30x reflect a conservative, well-structured approach to borrowing—only about 30% of its funding comes from debt, with the remainder supported by shareholders’ equity. A debt-to-EBITDA ratio of 1.16x indicates that total borrowings could be comfortably repaid within just over a year of operating earnings. Meanwhile, an asset-to-equity ratio of 2.07x signals balanced financing that avoids excessive reliance on borrowings while still leveraging debt to support growth.
Most notably, Beta’s interest coverage ratio of 18.36x underscores exceptional earnings strength relative to its interest obligations, meaning it can cover annual interest payments more than 18 times over—an indicator of strong solvency. Although smaller in scale than some peers, Beta maintains a predominantly long-term debt structure, suggesting stable financing arrangements even amid a marginal reduction in borrowings.
Nigerian Breweries Plc
Nigerian Breweries cut its debt aggressively, down 69.06% YoY to N182.03 billion in H1 2025 from N588.24 billion in H1 2024.
- Current debt: N152.03 billion
- Non-current debt: N30.00 billion
Nigerian Breweries Plc demonstrates a sound and balanced leverage position within its sector. As of H1 2025, the company carried total debt of N182.03 billion, offset by N77.70 billion in cash and cash equivalents, leaving a net debt position of N104.32 billion, a manageable level relative to its operating scale.
Its debt-to-equity ratio of 0.33x and debt-to-capital ratio of 0.25x show that only a quarter of its total funding is sourced from borrowings, with the majority supported by shareholders’ equity. The overall debt ratio of 0.16 reinforces its low reliance on debt, while an asset-to-equity ratio of 2.02x indicates that the company effectively uses moderate leverage to finance growth without overextending its balance sheet.
A debt-to-EBITDA ratio of 0.98x suggests that NB could repay its total borrowings in under a year of operating earnings, an efficient and comfortable coverage level. Its interest coverage ratio of 5.46x further signals that the company generates more than five times the earnings needed to service its interest obligations, reflecting solid cash flow and manageable financial risk.
Overall, Nigerian Breweries’ leverage profile reflects prudent capital management. Its conservative borrowing, backed by strong earnings, provides both financial stability and flexibility to navigate market challenges or invest strategically without creating excessive debt pressure.
Transcorp Plc
![]()
Transnational Corporation of Nigeria Plc saw debt rise modestly by 5.63% YoY, reaching N110.35 billion compared to N104.47 billion a year earlier.
- Current debt: N48.41 billion
- Non-current debt: N61.93 billion
Transcorp Plc maintains a conservative and well-balanced leverage position. By the first half of 2025, the company held total borrowings of N110.35 billion and N49.03 billion in cash and cash equivalents, resulting in a net debt position of N61.32 billion, moderate in relation to its operational scale and diversified portfolio.
Its debt-to-equity ratio of 0.39x and debt-to-capital ratio of 0.28x indicate that just over a quarter of its total funding is sourced from borrowings, with the majority supported by shareholders’ equity. A debt ratio of 0.12 reinforces its limited reliance on debt, while an asset-to-equity ratio of 3.18x reflects a solid equity base supporting a moderate level of leverage.
The company’s debt-to-EBITDA ratio of 1.13x shows that Transcorp could comfortably repay its borrowings within slightly more than one year of operating earnings—a sign of efficient debt management. Its interest coverage ratio of 6.49x highlights strong earnings capacity relative to interest costs, indicating robust solvency and manageable financial risk.
Overall, Transcorp’s prudent use of leverage, supported by healthy cash flow generation and a balanced debt structure, provides both financial stability and flexibility. This conservative approach positions the company to pursue growth opportunities in its power and hospitality businesses without overburdening its balance sheet.
Presco Plc

Presco recorded the fastest debt growth in percentage terms, rising 162.52% YoY from N59.25 billion in H1 2024 to N155.54 billion in H1 2025.
- Current debt: N14.08 billion
- Non-current debt: N141.47 billion
Presco Plc exhibits a moderate but purposeful use of debt within its capital structure. As of H1 2025, the company reported total borrowings of N155.54 billion, balanced by N97.69 billion in cash and cash equivalents, resulting in net debt of N57.85 billion, a manageable level relative to its operating scale and investment activities.
Its debt-to-equity ratio of 0.68x and debt-to-capital ratio of 0.40x indicate that 40% of its total funding is debt-financed, while the remaining 60% is supported by shareholders’ equity. A debt ratio of 0.25 confirms a manageable reliance on borrowings, and an asset-to-equity ratio of 2.67x suggests Presco leverages debt effectively to expand its asset base without excessive risk.
The company’s debt-to-EBITDA ratio of 2.45x shows that it would require just under two and a half years of operating earnings to repay its borrowings—higher than some peers but still within a reasonable range for a capital-intensive agribusiness. Its interest coverage ratio of 3.11x indicates that Presco’s earnings comfortably cover its interest obligations more than three times over, reflecting adequate but tighter solvency compared to more conservatively financed firms.
Overall, Presco’s leverage profile reflects an active investment strategy, using moderate debt to fund plantation and processing capacity expansion. While the company carries a higher debt burden than some peers, its earnings capacity and capital structure suggest manageable financial risk and sufficient flexibility to continue supporting growth initiatives.
BUA Cement Plc
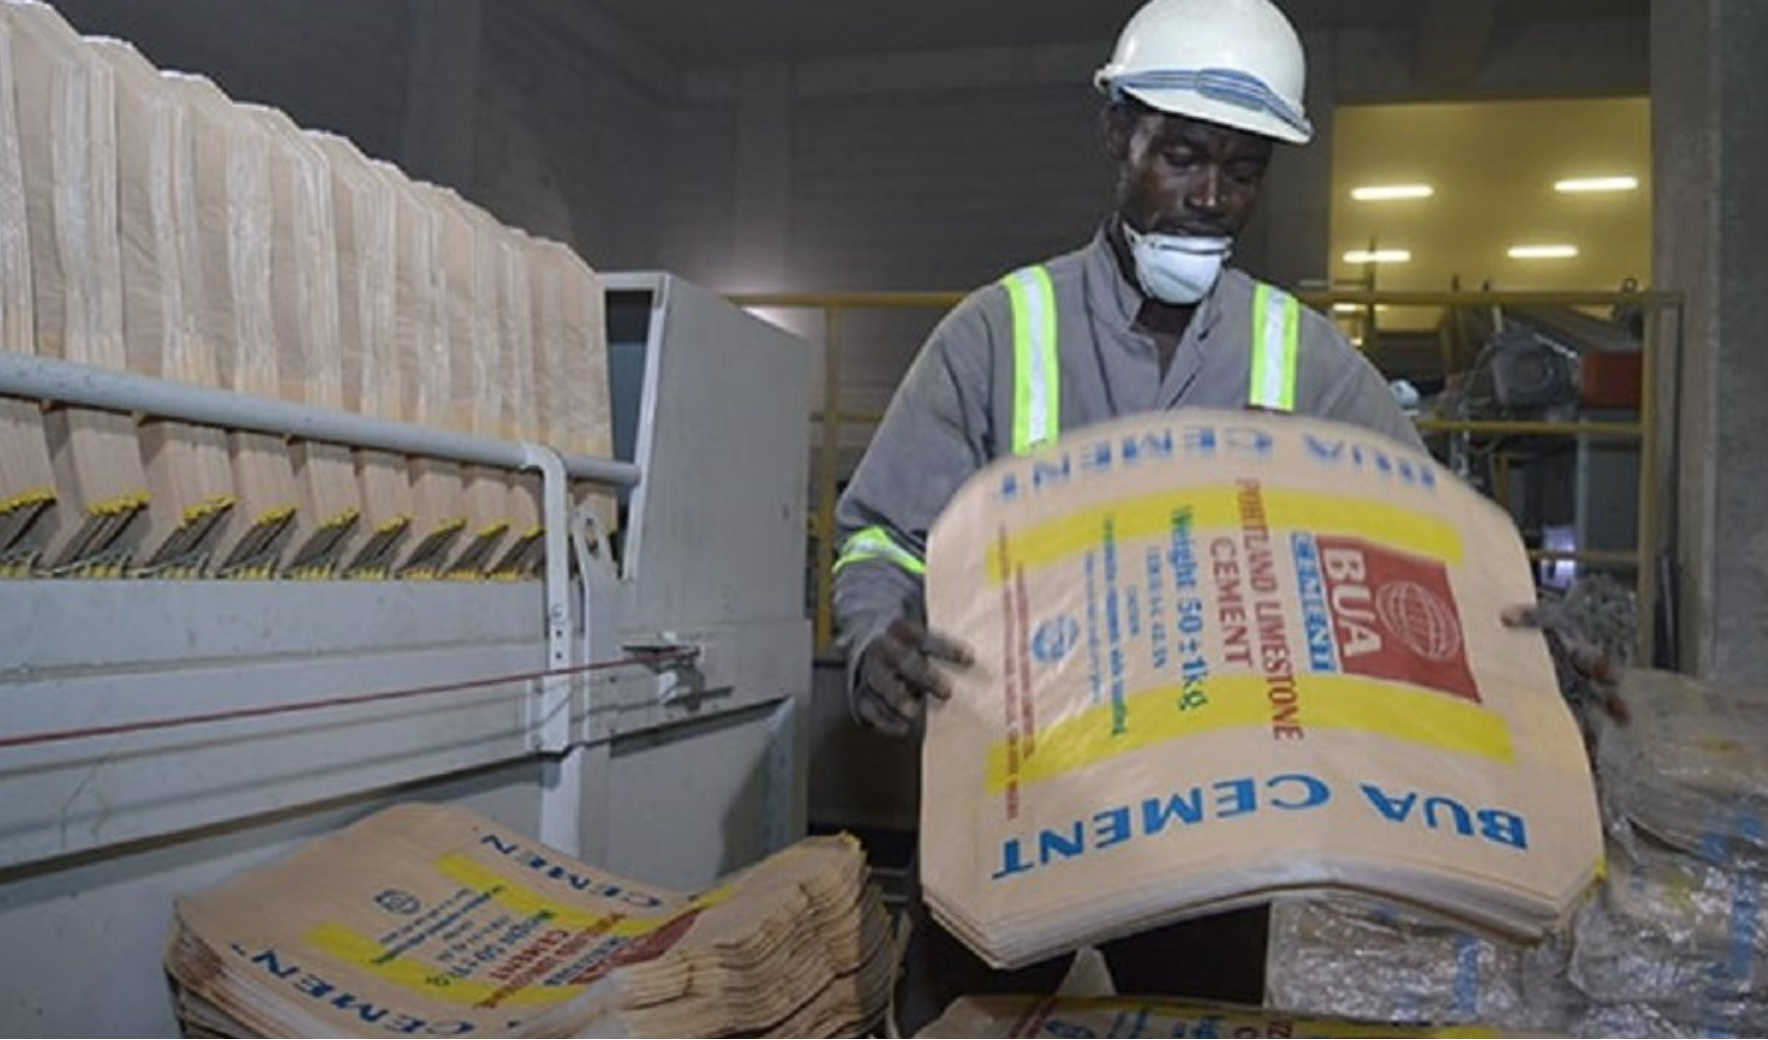
BUA Cement’s total debt fell by 13.82% YoY, closing H1 2025 at N476.97 billion from N553.47 billion a year earlier.
- Current debt: N59.62 billion
- Non-current debt: N417.35 billion
BUA Cement Plc presents a balanced yet moderately leveraged capital structure. As of H1 2025, the company reported total borrowings of N476.97 billion, offset by N163.41 billion in cash and cash equivalents, resulting in net debt of N313.57 billion, a level consistent with its capital-intensive expansion strategy.
Its debt-to-equity ratio of 0.84x and debt-to-capital ratio of 0.46x show that nearly half of its total funding comes from borrowings, with the rest supported by shareholders’ equity. A debt ratio of 0.30 underscores its measured reliance on debt, while an asset-to-equity ratio of 2.83x indicates a healthy, controlled level of gearing appropriate for a capital-intensive industry like cement manufacturing.
The company’s debt-to-EBITDA ratio of 1.77x suggests it would take less than two years of operating earnings to repay its borrowings, demonstrating manageable repayment capacity. Its interest coverage ratio of 6.44x reflects strong earnings relative to interest costs, providing ample room to meet financing obligations even under shifting market conditions.
Overall, BUA Cement’s leverage profile highlights prudent borrowing practices aligned with long-term capacity expansion projects. The combination of moderate gearing, solid cash flow generation, and healthy interest coverage positions the company as financially stable and flexible, capable of funding growth while maintaining balance sheet discipline.
MTN Nigeria Communications Plc
MTN reduced its borrowings to N813.77 billion, down 13.93% YoY from N945.45 billion.
- Current debt: N317.91 billion
- Non-current debt: N495.86 billion
MTN Nigeria Communications Plc presents an unusual leverage profile driven by its negative equity position. As of H1 2025, the telecom giant reported total borrowings of N813.77 billion, backed by N257.58 billion in cash and cash equivalents, resulting in net debt of N556.19 billion.
Its debt-to-equity ratio of -19.17x and asset-to-equity ratio of -112.40x indicate that liabilities significantly outweigh shareholders’ funds, resulting in negative equity. This structural imbalance suggests that the company’s balance sheet is heavily debt-dependent, a situation not uncommon for telecom operators managing large infrastructure investments and foreign-exchange pressures. Its debt-to-capital ratio of 1.06x further underscores that debt dominates its capital structure.
Despite the negative equity, MTN’s debt-to-EBITDA ratio of 0.68x shows that its borrowings could be repaid in well under a year of operating earnings—a sign of robust cash flow generation. The interest coverage ratio of 3.19x indicates that MTN earns more than three times its annual interest obligations, reflecting operational strength and the ability to meet financing costs even under challenging conditions.
Overall, MTN Nigeria’s leverage profile reflects a strong earnings engine offset by a weak balance sheet. While its negative equity raises long-term structural concerns, the company’s solid cash flows and moderate debt burden provide short- to medium-term resilience, giving it room to manage refinancing and operational investments as it works to strengthen its capital base.
Nestlé Nigeria Plc

Nestlé scaled back debt by 11.43%, from N653.92 billion in H1 2024 to N579.19 billion in H1 2025.
- Current debt: N63.36 billion
- Non-current debt: N515.83 billion
Nestlé Nigeria Plc shows a highly leveraged and structurally imbalanced capital position. As of H1 2025, the company reported total borrowings of N579.19 billion, backed by N37.40 billion in cash and cash equivalents, resulting in net debt of N541.79 billion, a substantial level relative to its operating scale and earnings.
Its debt-to-equity ratio of -13.88x and asset-to-equity ratio of -21.56x reflect a negative equity position, meaning liabilities exceed shareholders’ funds. This suggests accumulated losses or substantial debt exposure, leaving the balance sheet heavily debt-driven. The debt-to-capital ratio of 1.08x confirms that debt comprises nearly all of its capital base, a level far above typical industry norms.
The company’s debt-to-EBITDA ratio of 3.90x indicates that nearly four years of operating earnings would be required to repay its borrowings—significantly higher than peers, pointing to a heavier repayment burden. Its interest coverage ratio of 3.02x, while positive, shows thinner earnings headroom relative to interest costs compared to more conservatively financed competitors.
Overall, Nestlé Nigeria’s leverage profile highlights elevated financial risk despite continued operational earnings strength. While its cash flows currently support interest obligations, the negative equity position underscores the importance of careful balance sheet management and potential recapitalization efforts to restore a healthier capital structure over the long term.
Dangote Cement Plc
Dangote Cement reported total borrowings of N2.53 trillion, up 59.25% YoY from N1.59 trillion.
- Current debt: N1.13 trillion
- Non-current debt: N1.40 trillion
Dangote Cement Plc demonstrates a relatively high but manageable use of debt within its capital structure. As of H1 2025, the company reported total borrowings of N2.53 trillion, supported by N383.90 billion in cash and cash equivalents, leaving net debt of N2.15 trillion, a significant level that reflects its ongoing capacity expansion and regional growth projects.
Its debt-to-equity ratio of 1.14x indicates that borrowings exceed shareholders’ equity, while a debt-to-capital ratio of 0.53x shows that slightly more than half of its capital base is funded through debt. A debt ratio of 0.38 confirms a significant, though not excessive, reliance on borrowings. The asset-to-equity ratio of 2.98x suggests a geared but still stable balance sheet typical for large-scale, capital-intensive operations.
The company’s debt-to-EBITDA ratio of 2.68x means it would require nearly three years of operating earnings to fully repay its borrowings—higher than some peers, but within a tolerable range for an infrastructure-heavy industry. Its interest coverage ratio of 3.75x indicates that Dangote Cement generates almost four times the earnings needed to meet interest payments, signaling adequate but not abundant earnings headroom.
Overall, Dangote Cement’s leverage profile reflects a strategic use of debt to finance capacity expansion and regional projects, balanced by sufficient cash flow to cover obligations. While its debt load is higher than many peers, the company’s scale, operating strength, and industry positioning support its ability to manage financing costs and maintain financial stability.
Seplat Energy Plc
Seplat’s debt rose by 54.47% YoY, to N1.68 trillion in H1 2025 from N1.08 trillion in H1 2024.
- Current debt: N171.47 billion
- Non-current debt: N1.50 trillion
Seplat Energy Plc maintains a moderate and well-managed leverage position within the oil and gas sector. As of H1 2025, the company reported total borrowings of N1.68 trillion, supported by N641.28 billion in cash and cash equivalents, resulting in net debt of N1.03 trillion, a level consistent with funding capital-intensive exploration and production projects.
Its debt-to-equity ratio of 0.60x and debt-to-capital ratio of 0.38x show that just under 40% of its funding is sourced from borrowings, with the majority supported by shareholders’ equity. A debt ratio of 0.18 underscores its relatively low reliance on debt, while an asset-to-equity ratio of 3.38x indicates a healthy balance between equity and liabilities, typical for a capital-intensive upstream operator.
The company’s debt-to-EBITDA ratio of 1.45x suggests that Seplat could repay its borrowings in under a year and a half of operating earnings—comfortable for an exploration and production company with substantial cash flow generation. Its interest coverage ratio of 3.99x signals solid earnings capacity to service debt obligations, providing a buffer against market volatility or shifts in oil prices.
Overall, Seplat’s leverage profile reflects prudent financial management and disciplined use of borrowing to fund oilfield development and production activities. The combination of moderate gearing, healthy cash flows, and sound interest coverage positions Seplat as financially resilient and well placed to pursue growth while maintaining balance sheet stability.
Oando Plc
Oando Plc tops the list as the most indebted company, with a total debt of N3.19 trillion in H1 2025 — almost doubling from N1.61 trillion a year earlier (+98.54% YoY).
- Current debt: N1.12 trillion
- Non-current debt: N2.08 trillion
Oando Plc presents a highly distressed leverage position. As of H1 2025, the company reported total borrowings of N3.19 trillion, offset by only N227.71 billion in cash and cash equivalents, resulting in a net debt position of N2.97 trillion, substantial relative to its operating scale.
Its debt-to-equity ratio of -10.44x and asset-to-equity ratio of -22.10x reflect a negative equity base, meaning the company’s liabilities significantly exceed shareholders’ funds. A debt-to-capital ratio of 1.11x confirms that its capital structure is almost entirely debt-driven, leaving little to no equity buffer. The debt ratio of 0.47 indicates that nearly half of its total assets are financed through borrowings.
The company’s debt-to-EBITDA ratio of -27.90x suggests that operating earnings are negative, making its borrowings unsustainable under current performance levels. Additionally, an interest coverage ratio of -1.41x shows that Oando is not generating enough earnings to cover its interest obligations, underscoring significant financial strain.
Overall, Oando’s leverage profile signals severe balance sheet pressure and elevated financial risk. While its heavy borrowings have supported capital-intensive upstream operations and restructuring efforts, the negative equity and inability to cover interest costs highlight the urgency for substantial recapitalization, asset optimization, or restructuring to restore financial stability.

