The act of stock investing is not something that should be based on gut feelings but something that should be well thought out, methodical and strategic. A lot of investors do not have a trading strategy, therefore, lacking in entry and exit strategies. Such traders are those most affected whenever there is crisis in the market.
By definition, a trading strategy is a predefined set of rules for making trading decisions. There are three important elements of developing a trading strategy. They are entries, exits, and filters. While entries are signals that lead a trader or investor to initiate or generate a buy or sell (in situations where short selling is allowed) orders for new positions, exits signal to the investor when the expected value of a trade has diminished to the point that the trade should be closed. Filters on the other hand, caution the investor to only take the entries with highest profit potential over the life of the strategy.
Some of the entry methodologies in use in modern day trading include moving averages, channel breakouts, momentum indicators, volatility breakouts, oscillators and price patterns. Though there are more complex new entry methodologies, a good understanding of these basic ones will go a long way. You may have heard the saying” Always trade in the direction of the trend”. Trend following methods generate buy signals when a trending market is in a period of strength and generates a sell signal during periods of weakness in the market. Most trend followers use moving averages, channel breakouts, or volatility breakouts to generate entry signals. This article will discuss moving averages.
What are moving averages?
A moving average is a time series of the average of a set of numbers, in this case, stock prices. It is called “moving” average because as new prices are known, the oldest price is dropped, and the newest price is added to the calculation.
Why calculate moving average
Stock prices are not usually stable, they oscillate up and down thereby making it difficult to judge if such stock price movements are forming a pattern or not. Therefore, moving averages are used to smoothen out the data so as to make the trend or pattern clearer, more meaningful and amenable to judgment and decision making.
Types of Moving Averages: There are different types of moving averages, differing mostly in their computation methods and complexity but the most popular two are:
A Simple moving average (SMA) is calculated by adding all the data for a specific time period and dividing the total by the number of days. If Stanbic IBTC stock closed at 10, 11, 9, 19, and 20 over the last 5 days, the 5-day simple moving average would be ₦13.5 [(10+11+9+19+20)/5].
Exponential moving average (EMA) differs from the Simple Moving Average because the EMA assigns weights to the data with greater weights assigned to more recent data. The assignment of greater weight to recent data makes the EMA preferable to SMA by many traders.
There are other types of moving averages that are not discussed in this article, but it is important to note that you can choose between different moving average indicators and arrive at the same or similar decision. You can as well choose the length of time for calculating your moving average but the most commonly used are the 50-day and 200-day moving averages in either the exponential or simple form.
Why is Moving Average Popular Among Traders?
Moving average has been used by traders and investors for over 50 years. Without going into the explanation of what a moving average is and how it is calculated, it is important to state that the basic trading signal for moving averages are triggered when prices cross above or below a moving average. This is because when prices cross above the moving average, higher prices are most likely, and it signals that it is time to buy.
On the other hand, when prices cross below the moving average, a declining market is predicted or expected to signal that it may be time to sell. Ordinarily, moving average of 20 to 200 days are used to generate buy or sell signals, however, shorter averages respond quicker to recent price movements, but they are prone to generating false signals (or noise). Longer averages, while producing infrequent trading signals are not so prone to false signals. It is therefore advisable to strike a good balance between the need to capture recent price moves and the ability to deal with false signals especially where trading commissions are involved. Depending on the length of the average you decide to use, the trading rule should be:
Buy when today’s closing price crosses above “t” day moving average and sell when today’s closing price crosses below “t” day moving average, where “t” is the moving average length or period of your choice, in days

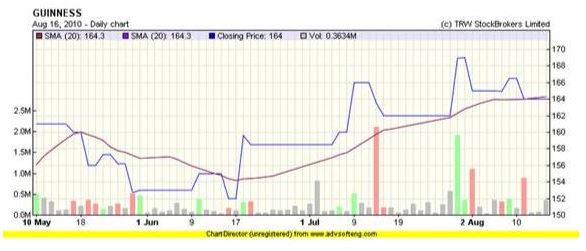
As can be seen from the above chart which shows 10-day simple moving average (SMA) of Guinness Nigeria Plc, the closing price crossed above and below the moving average at many points. Notice that around June 15th, the closing price crossed below the 10-day moving average signaling a sell, however, 2 days later, on the 17th it crossed above signaling a buy. Another sell signal was generated or triggered on or around August 10th as that day’s close crossed below the moving average.
However, when a 20-day moving average is used (chart not shown), it becomes more apparent that the August 10th signal was indeed a false signal because the day’s close did not actually cross below the 20-day moving average. According to the 20-day moving average, trading signals were generated on May 18th (a sell signal), June 15th (another sell signal) and June 17th (a buy signal). It is instructive to note that the longer the trend, the more profitable the moving average strategy. This can be seen from the above charts that a buy entry on June 17th looks quite profitable given the length of the trend since then.
Caveat
One drawback with moving average method is that when markets are choppy, or when markets trend sideways, as happed between 9th and 16th of June, longs are liquidated, most times at a loss. Care should therefore be taken in situations where the market shows no discernable trends as this may lead to losses. Under such a situation, it may be better to use longer length moving averages to cut out the whipsaws.
Note that, helpful as moving averages are in stock trading, it should not be used as the sole stock selection tool. It may be better to combine it with other stock-picking tools. Using a combination of moving averages have been known to yield better trading signals and such combinations, popularly called moving average cross overs will be the subject of my next article.


