Lafarge Africa Plc (Consolidated 9 months ended September 2014)
Volume growth in Nigeria buoys group revenue
- Lafarge Africa Plc (Lafarge) released its first consolidated financial results for 9 months ended 30th September 2013, wherein revenues rose 3.4% YoY to N159 billion. In view of the sluggish growth of the South African cement market, we believe the business’ 9M 14 revenues was driven by a 5.5% YoY volume growth in Nigerian operations – which is largely accounted for by WAPCO, where 7% YoY increase in volumes amidst higher cement prices drove a 15% YoY rise in revenue (vs. Ashaka’s revenue growth of 3% in the same period).
… as more efficient energy mix drives gross margin expansion
- Largely reflecting improved energy mix, 9M 14 COGS, which contracted a modest 1% YoY to N104billion, drove gross profits 13.5% higher YoY to N55 billion, with related margins firming up 3.1pps to 34.7%. Management attributed these gains to improved gas utilization at Ewekoro I & II (~90% for 9M 14) as well as higher coal utilization at Ashaka which, at 68%, is the double utilization rate over the same period in 2013. Despite the expansion in GM, it is 460bps below pre-consolidation level and affirms our view of the dilutive impact the South African business could have on margins.
Figure 1: Gross margins of cement companies (9 months)
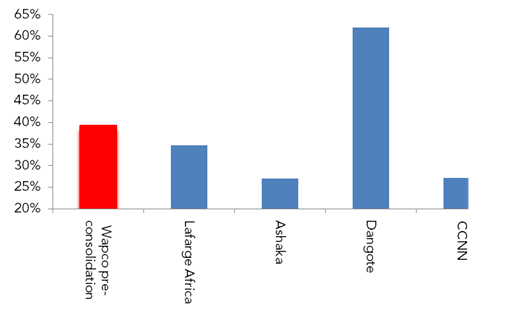
Source: Company financials, ARM Research
- 9M 14 operating expenses rose 9% YoY to N16 billion, likely reflecting higher depreciation charges on capitalized cost of 300 flat bed trucks and 30 additional bulk tankers purchased by the company to support market penetration. Nevertheless, reflecting net impact of gross margin expansion, EBIT rose 15.4% YoY to N39billion with related margins 2.6pps higher YoY at 24.6%.
Normalization of investment income drives earnings weakness…
- Lafarge reported net finance charge of N822 million (vs. net finance income of N19 billion for 9M 13), as a 97% YoY decline in investment income to N572 million offset the impact of 43% YoY moderation in finance charges to N1.4 billion. Notably, investment income weakness reflects base effects from 2013 when Lafarge’s South African subsidiary reported gains of N19.4 billion from disposal of Pan African Cement. Consequently, 9M 14 PBT shrank 28% YoY to N38 billion, whilst a 10.4 pps YoY rise in effective tax rates to 16.5% resulted in a wider contraction (36% YoY) in PAT to N32 billion. Corresponding PBT and PAT margins are 10.6pps and 12.8pps lower YoY at 24.1% and 20.1% respectively.
… though proforma shows improved bottomline
- However, adjusting for the one-off item reveals that normalized 9M 14 PBT and PAT rose 12.7% and 4.1 YoY to N38 billion and N32 billion respectively, with related margins firming up 2pps and 10bps YoY to 24.1% and 20.1% respectively. Margins are however, below WAPCO’s pre-consolidation 9M 13 levels of 27.8% (PBT) and 27.5% (PAT).
Figure 2: Lafarge Africa’s pre and post consolidation profitability margins
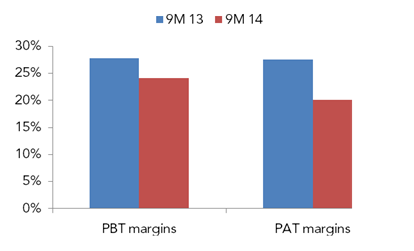
- Source: Company financials, ARM Research
Lower margins on recent cement price cut dampens outlook
- Overall, while top-line and normalized bottom-line showed improvements, lower margins relative to pre-consolidation levels affirms our view on the dilutive impact the South African business will have on the combined entity. Looking ahead, though we expect overall volumes to be supported by cement demand in Nigeria, margins are likely to come under additional pressure, as we expect the company to lower prices to maintain market share in response to the recent price cut by Dangote Cement (DCP).
- Similar to the broader cement sector, Lafarge has declined strongly (-29%) to N78.1 following the latest price cut announcement by DCP on November 1, 2014, but given limited information on the consolidated figures, we have not incorporated current numbers into our model. Lafarge trades at current PE of 14.7x relative to DCP’s 15.6x. Our valuation model is under review.
Source: ARM


