Julius Berger Plc is a renowned construction firm in Nigeria and has been in existence for decades. The Company has been involved in several large scale projects over the years building roads and bridges that have connected cities and towns. They are also quoted in the Nigerian Stock Exchange and currently have a market capitalisation of about N92.3billion. It’s a stock on my radar and one I potentially want to have in my portfolio for September.
As a value investor, it is important to determine the intricate value of a stock before making a decision on whether to purchase the stock or not. To determine an appropriate price it is important to understand the historical performance of the company.


5 Year Profit and Loss and Balance Sheet
Julius Berger has handled projects worth about N809billion in the last 5 years alone. That is an astonishing figure that is not likely to reduce any time soon. In fact, revenues have grown at a Compounded Annual Growth Rate of 12% per annum. But they operate in a highly capital intensive and often low margin industry with expenses slicing off a huge chunk of that revenue. Simple average profit margins for the last years for example is just 3%. But this is not a problem as it is not uncommon in the industry. In fact, this low margins is very well compensate by the high Returns on Equity they are able to generate. ROE has averaged 50% in the last five years and growing. Below is snap shot of the company’s 5 year historical financials along with its indices.
Five Year Profitability

5 Years Indices

Share Price History
In 2008 when its share price was at its high of N75 it had an EPS (based on outstanding shares that year of 1.2b shares) of N2.09 representing a P.E of 25.8x. That was when the Stock market was riding a bubble. Today its share price of N76.9 has a P.E of 11.6x.

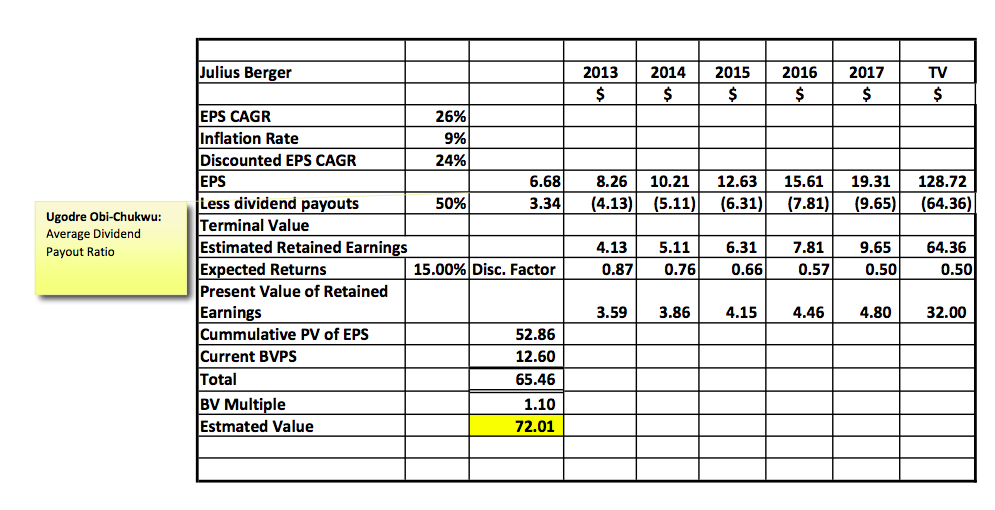
Valuation
Assumptions
- Method used is a Discounted Cash flow on future profit after tax and dividends.
- Current Book value per share is added back to PV of Future Discounted Retained Earnings
- Buyer is a minor shareholder with no intention to hold controlling interest.
- Buyer has no control over the free cash flows of the company.
- Shares will be held for a minimum of 5 years
- Compounded Annual Growth Rate (CAGR) for Earnings is based on past 5 years historicals
- The company will continue to grow revenues at a CAGR of at least 12% PA
- CAGR for earnings will continue to grow at historical average of 26%
- Average future 5 year inflation rate of 9%
- Expected Earnings Yield of 15%
- Expected dividend yield of at least 7%pa
- At least a 50% dividend payout ratio
- Price to Book Value multiple of 1.1
- Current Share price N76.95
- Current P.E Ratio 11.6
- Current Price to book ratio 6.1x

My analysis suggest the following price range for Julius Berger.
LOW BID – N65
HIGH – N72
PREFERRED ENTRY PRICE – N67
CURRENT PRICE – N76.95
ESTIMATED PRICE IN 5 YRS – N222
POTENTIAL UPSIDE PER PREFERRED BID – N155
The valuation in basically mine and based on my assumptions and opinion. A different approach may present a lower or higher valuation that mine. Valuations are subjective as no one can predict the future.


