 Follow Us on Google Discover
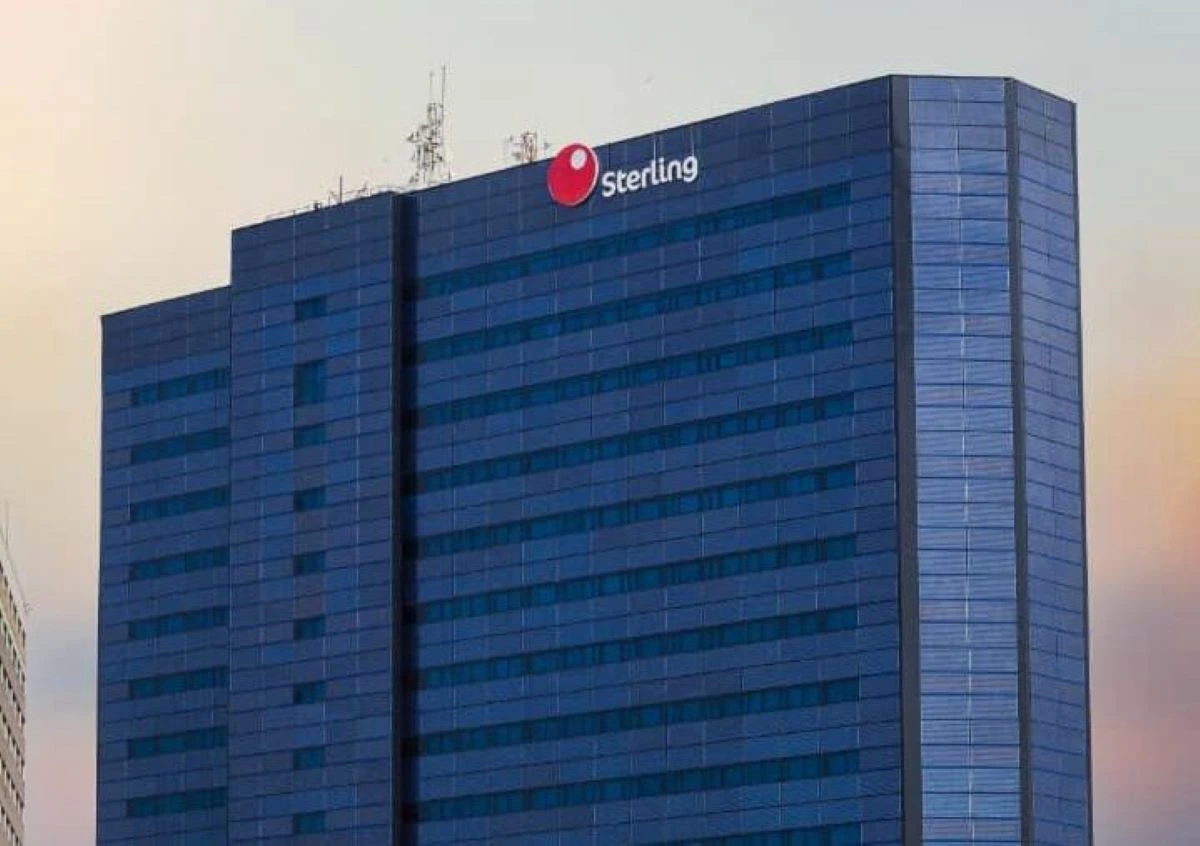
Sterling Financial Holdings Company Plc reported a pre-tax profit of N97.28 billion in its unaudited financial results for the nine months ended 30 September 2026, representing an increase of 37.09% from N70.96 billion recorded in the corresponding period of 2025.
The growth in profitability was supported by a 33.15% increase in gross earnings to N454.94 billion from N341.67 billion, driven largely by stronger interest income and other operating income.
Consequently, profit after tax increased by 20.99% to N75.37 billion from N62.30 billion, although earnings per share declined by 11.47% to N11.35 from N12.82, based on figures restated for the company’s share reconstruction.
Key Highlights
- Gross earnings: N454.94 billion (Up 33.15% YoY from N341.67 billion).
- Interest income: N353.78 billion (Up 34.82% YoY from N262.42 billion).
- Interest expense: N147.88 billion (Up 23.88% YoY from N119.38 billion).
- Net interest income: N205.90 billion (Up 43.94% YoY from N143.04 billion).
- Net fees and commission income: N39.63 billion (Up 10.44% YoY from N35.88 billion).
- Basic earnings per share: N11.35 (Down 11.47% YoY from N12.82, both restated for the share reconstruction).
- Total assets: N5.10 trillion (Up 30.36% from N3.91 trillion in December 2025).
- Customer deposits: N3.84 trillion (Up 28.74% from N2.98 trillion in December 2025).
- Loans and advances to customers: N1.82 trillion (Up 28.77% from N1.41 trillion in December 2025).
- Total equity: N595.16 billion (Up 38.83% from N428.70 billion in December 2025).
Driving the numbers
Sterling’s nine-month performance was driven mainly by stronger interest earnings, reflecting continued growth in its income-generating activities.
Also Read
Interest income increased by 34.82% to N353.78 billion, accounting for 77.76% of the group’s gross earnings of N454.94 billion.
- The growth was driven mainly by interest earned on loans and advances to customers, which increased by 39.65% to N244.42 billion from N175.03 billion, contributing 69.09% of total interest income.
- Income from debt instruments at fair value through other comprehensive income increased by 26.14% to N57.73 billion from N45.77 billion, contributing 16.32% of total interest income.
- Similarly, income from cash and cash equivalents rose by 36.10% to N32.03 billion from N23.53 billion, accounting for 9.05% of total interest income.
- Meanwhile, income from debt instruments at amortised cost increased by 8.36% to N19.61 billion from N18.09 billion, contributing 5.54% of total interest income.
Funding costs
Funding costs also increased, although at a slower rate than interest income.
- Interest expense rose by 23.88% to N147.88 billion from N119.38 billion, driven mainly by interest on customer deposits, which increased by 23.06% to N92.43 billion, accounting for 62.50% of total interest expense.
- Interest on deposits from banks increased by 35.71% to N21.40 billion, contributing 14.47%, while returns to investment account holders rose by 53.29% to N20.57 billion, representing 13.91%.
- Interest expense on other borrowed funds also increased by 21.62% to N13.45 billion, accounting for 9.09% of total interest expense
Non-interest income
Performance across non-interest income was mixed. Net fees and commission income increased by 10.44% to N39.63 billion from N35.88 billion, driven by growth in other fees and commissions, facility management fees and electronic banking income.
- Other fees and commissions more than doubled to N8.48 billion from N3.88 billion, while facility management fees increased by 39.09% to N9.42 billion from N6.77 billion.
- E-business commissions rose 17.19% to N8.26 billion, while account maintenance fees increased by 14.78% to N6.88 billion.
- However, commissions on letters of credit and off-balance-sheet transactions declined to N13.30 billion from N14.31 billion.
- However, fees and commission expenses increased to N10.18 billion from N8.47 billion, limiting net income growth
Another non-interest income; net trading income declined by 6.47% to N21.30 billion from N22.78 billion.
- Other operating income provided additional support to the group’s earnings, increasing by 95.37% to N40.23 billion from N20.59 billion.
Credit impairment and operating expenses
Credit impairment remained one of the biggest pressures on profitability.
- Credit loss expenses increased substantially to N40.28 billion from N8.09 billion in the corresponding period of 2025.
- In the third quarter alone, impairment charges reached N16.43 billion, compared with N2.87 billion in the third quarter of 2025.
This indicates that a larger portion of operating income was absorbed by provisions for potential credit losses.
Despite these pressures, operating income increased by 38.13% to N307.06 billion, helping the group deliver higher pre-tax earnings.
- However, income tax expenses rose to N21.91 billion from N8.66 billion, limiting profit after tax growth to 20.99%.
Balance sheet
Sterling’s balance sheet expanded significantly during the nine-month period. Total assets increased to N5.10 trillion from N3.91 trillion in December 2025, driven by customer deposits.
- Customer deposits also increased by 28.74% to N3.84 trillion, remaining the group’s largest funding source.
The deposit balance was more than twice the size of the customer loan portfolio, highlighting the scale of deposit funding relative to lending activities.
- Loans and advances to customers increased by 28.77% to N1.82 trillion, compared with N1.41 trillion at the end of 2025.
Total equity increased by 38.83% to N595.16 billion, supported by retained earnings and proceeds from the group’s public offering.
On asset quality, the group’s non-performing loan ratio stood at 4.6%, compared with 4.7% in December 2025.
Market reaction
Sterling Financial Holdings’ share price gained 1.32% on 28 October 2026, closing at N77.00 from N76.00 in the previous trading session, following the approval of its unaudited nine-month financial results on 27 October 2026.
Trading activity also increased significantly, with 3.80 million shares exchanged on 28 October, compared with 487,524 shares in the previous session.
The stock had closed unchanged at N76.00 on 27 October, after declining by 0.65% on 26 October 2026.