 Follow Us on Google Discover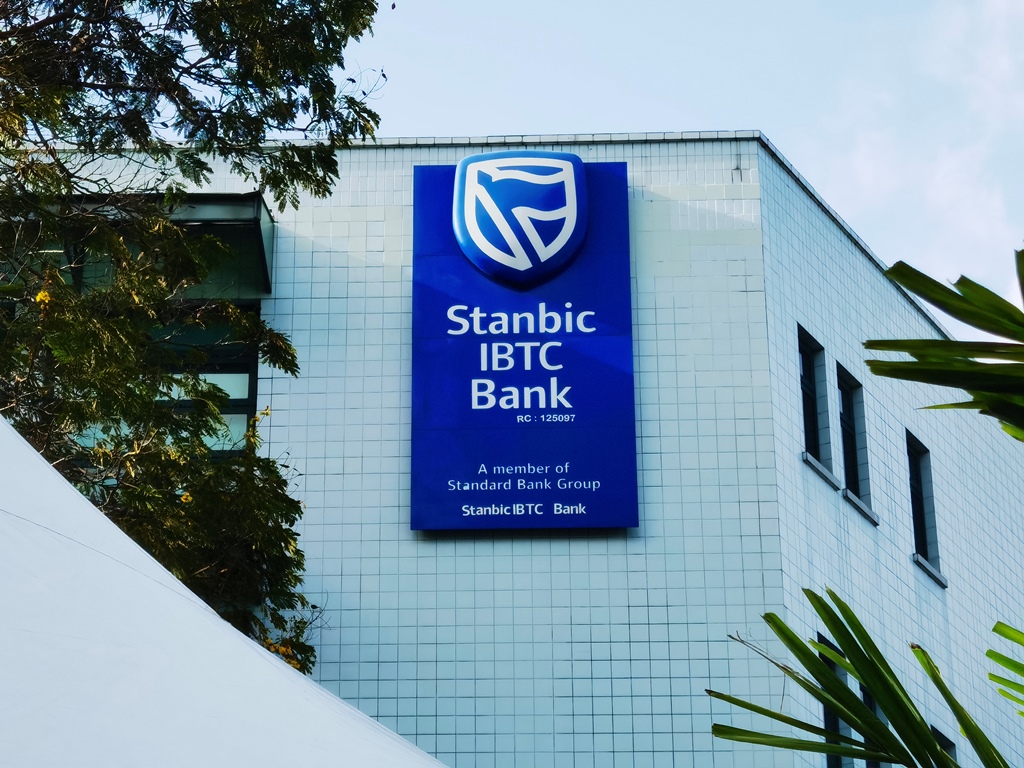
Stanbic IBTC Holdings Plc has released its H1 2026 results, reporting a 40.13% increase in profit before tax for the period ended June 30, 2026.
The Group also recorded a 27.15% increase in gross earnings, while profit after tax rose by 38.20% compared with the corresponding period of 2025.
The Board recommended an interim dividend of N4.50 per ordinary share, representing an 80% increase from the N2.50 per share declared for H1 2025.
Key Highlights (H1 2026 vs. H1 2025)
- Gross earnings: N650.31 billion; +27.15% YoY
- Interest income: N359.10 billion; -5.40% YoY
- Interest expense: N92.83 billion; +34.98% YoY
- Net interest income: N266.28 billion; -14.34% YoY
- Non-interest revenue: N278.02 billion; +125.88% YoY
- Net fee and commission revenue: N145.26 billion; +27.08% YoY
- Trading revenue: N126.36 billion, versus a N856 million trading loss in H1 2025
- Net impairment loss: N7.36 billion; -33.75% YoY
- Operating expenses: N195.38 billion; +9.11% YoY
- Basic EPS: N14.90; +38.22% YoY
- Total assets: N10.91 trillion; +26.59% from N8.62 trillion in Dec. 2025
- Loans and advances to customers: N2.59 trillion; +8.82% from N2.38 trillion
- Deposits from customers: N4.63 trillion; +5.90% from N4.37 trillion
- Total equity: N1.30 trillion; +15.27% from N1.12 trillion
Driving the numbers
Stanbic IBTC’s pre-tax profit was driven by a sharp increase in non-interest revenue, particularly trading income, alongside stronger fee and commission income and lower impairment charges, which more than offset weaker net interest income and higher operating costs.
The topline remained strong in H1 2026, with gross earnings increasing by 27.15% to N650.31 billion from N511.45 billion.
However, interest income declined by 5.40% to N359.10 billion from N379.61 billion, while interest expense increased by 34.98% to N92.83 billion from N68.77 billion.
This pushed net interest income down 14.34% to N266.28 billion from N310.83 billion. Stanbic IBTC H1 2026(2).
However, lower impairment charges provided further support. Net impairment losses on financial assets declined by 33.75% to N7.36 billion from N11.10 billion, allowing income after credit impairment charges to rise to N536.94 billion from N422.81 billion. Stanbic IBTC H1 2026(2)
Another boost came from non-interest revenue, which more than doubled to N278.02 billion from N123.08 billion.
This was driven largely by trading revenue, which swung to a N126.36 billion gain from a N856 million loss in H1 2025.
Net fee and commission revenue also increased by 27.08% to N145.26 billion from N114.31 billion. Stanbic IBTC H1 2026(2).
Operating expenses
However, operating costs increased as total operating expenses rose by 9.11% to N195.38 billion from N179.07 billion, with staff costs increasing to N60.04 billion from N53.63 billion and other operating expenses rising to N135.34 billion from N125.44 billion.
But the strong growth in non-interest revenue and lower impairment charges outweighed the decline in net interest income and higher expenses, pushing profit before tax up 40.13% to N341.57 billion from N243.74 billion.
Profit after tax increased by 38.20% to N239.68 billion from N173.43 billion, despite income tax expense rising to N101.88 billion from N70.31 billion.
Balance sheet
On the balance sheet, total assets grew by 26.59% to N10.91 trillion from N8.62 trillion, supported by an increase in deposits and a sharp expansion in trading assets.
Customer deposits rose 5.90% to N4.63 trillion from N4.37 trillion, equivalent to about 42.43% of total assets.
Much of the balance-sheet expansion was reflected in trading assets, which jumped 235.42% to N2.89 trillion from N862.16 billion, increasing their share of total assets to about 26.50%.
Financial investments also increased 9.97% to N1.63 trillion.
Customer loans, meanwhile, grew 8.82% to N2.59 trillion from N2.38 trillion, suggesting that asset growth tilted more towards trading assets than lending.
Meanwhile, cash and bank balances declined 17.98% to N1.39 trillion from N1.70 trillion, while total liabilities increased 28.29% to N9.62 trillion.
Deposits from banks surged 169.34% to N1.10 trillion from N409.67 billion, while other borrowings declined 3.37% to N526.89 billion, and debt securities issued fell 48.46% to N175.60 billion.
Total equity increased 15.27% to N1.30 trillion from N1.12 trillion. However, equity’s share of total assets declined to about 11.87% from 13.04%, as assets expanded faster than shareholders’ fund
Share price performance
Stanbic IBTC began 2026 at N100.00 per share and has since gained about 64% year-to-date, placing the share price at around N164.00.
The strong share-price performance means investors will be assessing whether the substantial earnings growth recorded in H1 2026 is sufficient to support the stock’s higher valuation.
What happens next will depend on how investors assess the sustainability of the 40.13% growth in pre-tax profit, the 38.20% increase in profit after tax, and the significantly higher N4.50 interim dividend, particularly after the stock’s roughly 64% year-to-date rally.