 Follow Us on Google Discover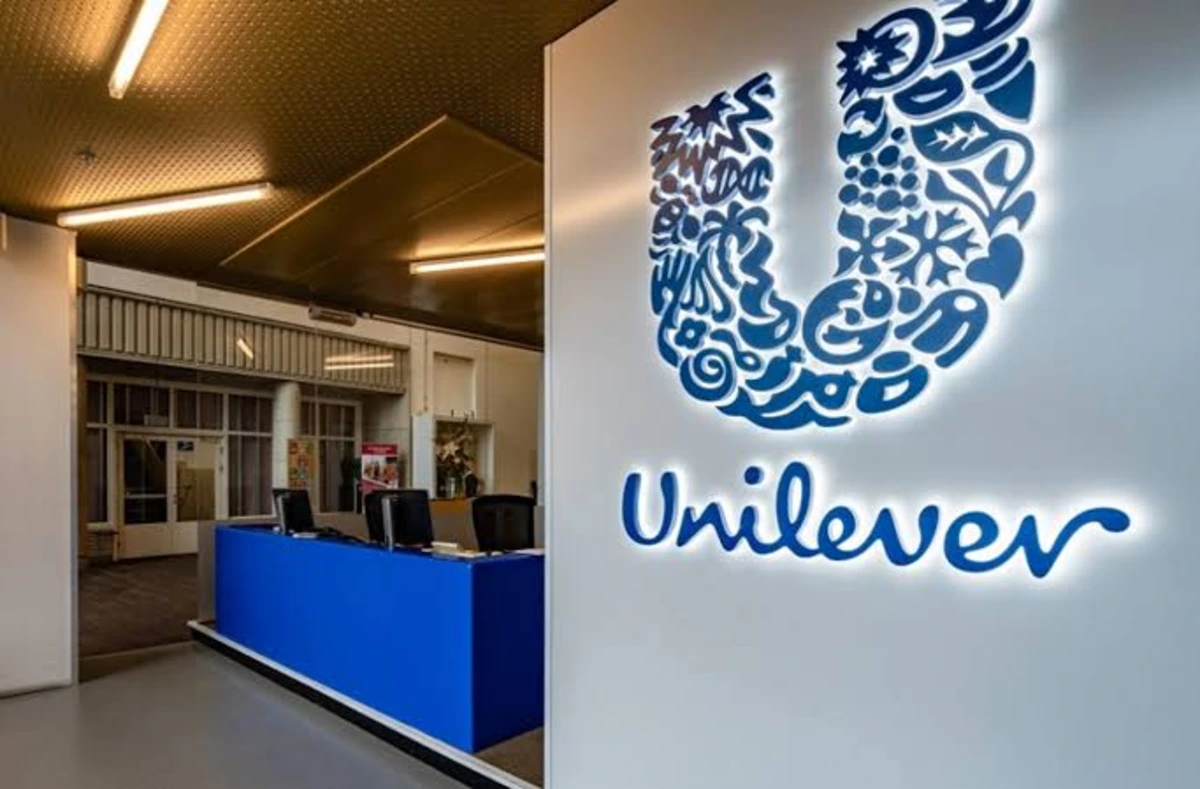
Unilever Nigeria Plc has released its unaudited H1 2026 financial results, reporting pre-tax profit of N29.2 billion for the first half of the year, representing 20.79 YoY increase from N24.154 billion recorded in the corresponding period of 2025.
The company’s profit after tax rose to N15.597 billion, compared with N14.51 billion in H1 2025, supported by higher revenue.
Revenue increased to N119.92 billion in H1 2026, compared with N98.10 billion in H1 2025, while earnings per share increased to N2.72 from N2.51 over the same period.
Alongside the results, Unilever Nigeria proposed an interim dividend of N2.00 per ordinary share for shareholders, subject to applicable withholding tax.
The qualification date is 31 July 2026, while dividend payment is scheduled for 14 August 2026.
Key Highlights (H1 2026 vs H1 2025)
- Revenue: N119.9 billion, up 22.2% YoY from N98.1 billion
- Cost of Sales: N65.2 billion, up 16.4% YoY from N56.0 billion
- Gross Profit: N54.7 billion, up 30.0% YoY from N42.1 billion
- Operating Profit: N42.1 billion, up 72.8% YoY from N24.4 billion
- Total Assets: N177.2 billion, down 1.6% YoY from N180.2 billion
- Cash and Cash Equivalents: N97.2 billion, down 12.3% YoY from N110.8 billion
- Total Liabilities: N72.9 billion, up 0.2% YoY from N72.7 billion
- Loans and Borrowings: N2.1 billion, down 2.2% YoY from N2.2 billion
- Total Equity: N104.4 billion, down 3.1% YoY from N107.5 billion
Driving the numbers
Unilever Nigeria’s H1 2026 performance was driven primarily by revenue growth across its major business segments and improved operating leverage.
- Revenue increased by 22.2% YoY to N119.92 billion from N98.10 billion in H1 2025, supported by growth across Foods, Personal Care, and Beauty & Wellbeing.
- The Foods segment remained the largest contributor, generating N77.05 billion in revenue compared with N58.68 billion in H1 2025, representing 31.3% YoY increase. The segment accounted for approximately 64% of total revenue during the period.
- Personal Care revenue increased to N30.97 billion from N29.59 billion, while Beauty & Wellbeing rose to N11.90 billion from N9.83 billion.
By geographical market, Nigeria remained the company’s dominant revenue source, contributing N117.20 billion, representing about 98% of total revenue.
- Export revenue, although smaller in contribution, recorded stronger growth, increasing to N2.72 billion from N1.46 billion, an 85.8% YoY increase.
- The increase in revenue translated into stronger gross profitability. Gross profit expanded by 30.0% YoY to N54.74 billion from N42.12 billion, as cost of sales increased at a slower pace than revenue.
- Cost of sales rose by 16.4% to N65.18 billion, resulting in an improvement in gross margin during the period.
- Operating profit recorded a stronger increase, rising 72.8% YoY to N42.12 billion from N24.36 billion.
The improvement came despite higher operating expenses, with selling and distribution expenses increasing to N4.77 billion from N3.00 billion, while marketing and administrative expenses rose to N26.39 billion from N21.00 billion.
The faster growth in gross profit allowed the company to absorb these cost increases and deliver stronger operating profitability.
- At the segment level, total segment operating profit increased to N24.36 billion from N18.81 billion, with Foods contributing N15.65 billion, Personal Care contributing N6.29 billion, and Beauty & Wellbeing contributing N2.42 billion.
- Finance income increased by 11.8% YoY to N6.51 billion, supported by higher interest income from call deposits and bank balances.
However, the benefit was partly offset by a sharp increase in finance costs, which rose to N1.70 billion from N483.50 million.
The increase was mainly driven by a N1.33 billion foreign exchange loss on bank balances, which was not recorded in the previous period.
As a result, net finance income declined to N4.82 billion from N5.34 billion.
Despite the increase in operating profit, higher finance costs and taxation, limited bottom-line growth, with profit before tax rising 20.8% YoY to N29.18 billion, while profit after tax increased 8.3% YoY to N15.60 billion.
Balance Sheet
Unilever Nigeria’s balance sheet remained strong in H1 2026, with total assets standing at N177.24 billion as of 30 June 2026, compared with N180.18 billion at the end of 2025, representing 1.63% decline.
- The decline in total assets was largely driven by a reduction in current assets, particularly cash and cash equivalents, which fell to N97.15 billion from N110.75 billion, representing a 12.28% decline.
- Despite the reduction, cash remained the largest component of the company’s asset base, accounting for approximately 54.8% of total assets at the end of the period.
- The equity base stood at N104.38 billion as of 30 June 2026, representing a 2.9% decline from N107.46 billion at the end of 2025.
The decline was driven mainly by a reduction in retained earnings, which fell to N44.70 billion from N47.77 billion, despite the company reporting a profit after tax of N15.60 billion during the period.
Market reaction
Unilever Nigeria shares closed at N125.00 on 20 July 2026, gaining 0.8% from the previous close of N124.00.
Following the release of the H1 2026 results, the stock closed at N125.00 on 21 July 2026, indicating a flat reaction on the results announcement day.
The stock has delivered a strong performance across different time frames, rising 73.6% year-to-date, 61.4% over the past six months, and 116% over the past one year.