 Follow Us on Google Discover
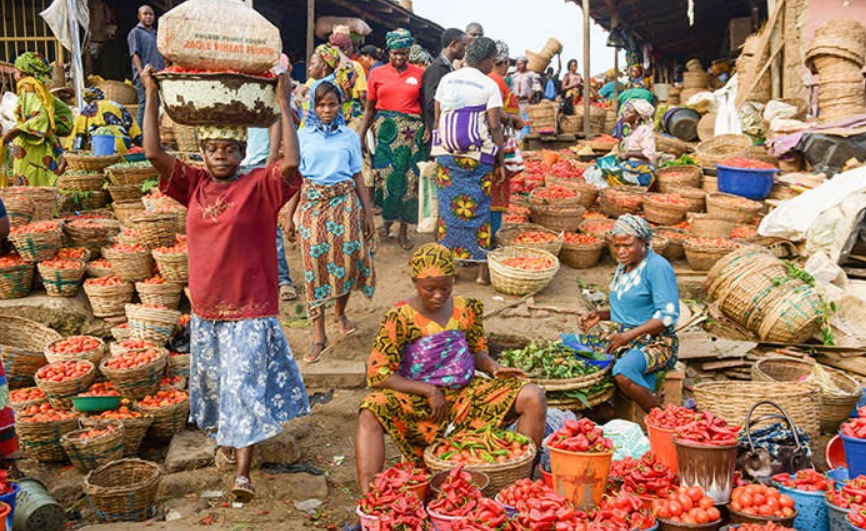
As Nigerian workers mark Workers’ Day on May 1, the latest inflation data shows that the cost-of-living burden remains uneven across states.
The ranking is based on the March 2026 Consumer Price Index (CPI) data collated by Nairametrics from the National Bureau of Statistics (NBS), using the annual all-items change as the main cost-of-living index.
The NBS report showed that headline inflation rose to 15.38 per cent in March 2026 from 15.06% in February, while month-on-month inflation accelerated to 4.18% from 2.01%, indicating renewed pressure on household budgets despite a lower annual inflation rate compared with March 2025.
Food prices remained a major factor in the cost-of-living picture. National food inflation stood at 14.31% year-on-year in March 2026, but several states in the most expensive group recorded food inflation far above the national average, showing that workers in those states faced a double squeeze from general price increases and higher food costs.
Also Read
Most expensive states
Plateau
Plateau ranked 10th among the most expensive states, with all-items inflation at 19.6% year-on-year. Its consumer price index rose from 112.0 in March 2025 to 133.9 in March 2026.
Food inflation stood at 15.7%, slightly above the national food inflation rate. This means food was a contributor to the pressure but not the dominant driver. On a monthly basis, food prices rose by 4.2%, while all-items inflation increased by 4.5%, showing broad-based price pressure beyond food.
Yobe
Yobe recorded an annual all-items inflation of 19.7%, placing it just above Plateau. Its all-items index rose from 111.4 in March 2025 to 133.3 in March 2026.
Food inflation was 16.9%, higher than the national food rate. The monthly food increase of 5.8% also exceeded the all-items monthly rise of 5.5%. This suggests that food was a key driver of short-term inflation in the state.
Niger
Niger ranked eighth, with all-items inflation at 20.7%. Its all-items index increased from 113.1 to 136.5 within one year.
Food inflation was also high at 19.0%. On a month-on-month basis, food rose by 8.6%, while all-items inflation increased by 8.4%. This shows that food was a major driver of the cost-of-living pressure facing workers in the state.
Taraba
Taraba recorded an annual all-items inflation of 21.2%, with its index rising from 112.7 in March 2025 to 136.6 in March 2026.
Food inflation was 15.5%, lower than the all-items inflation rate. This indicates that non-food items likely played a larger role in the state’s overall cost pressure. The monthly all-items rate of 6.4% was also higher than the 3.9% recorded for food, reinforcing the point.
Akwa Ibom
Akwa Ibom ranked sixth among the most expensive states, with annual all-items inflation at 22.2%. The all-items index rose from 107.8 in March 2025 to 131.8 in March 2026.
Food inflation stood at 17.6%, below the all-items rate. Monthly food inflation was 3.0%, while all-items inflation was only 1.8%. This shows that annual pressure was broad, but the latest monthly data points to some moderation in general price increases.
Kwara
Kwara recorded annual all-items inflation of 22.9%, with the all-items index rising from 110.8 to 136.2.
Food inflation was 21.7%, close to the all-items rate, making food a major contributor to the state’s cost-of-living pressure. On a monthly basis, food rose by 7.5%, compared with 5.7% for all items. This means food prices were rising faster than the general basket in March.
Cross River
Cross River ranked fourth, with all-items inflation of 23.6%. Its all-items index rose from 109.2 in March 2025 to 135.0 in March 2026.
Food inflation stood at 21.4%, also close to the general inflation rate. Monthly food and all-items inflation both stood at 4.0%, showing that food and non-food categories moved at a similar pace in March.
Bauchi
Bauchi ranked third, with annual all-items inflation at 23.7%. Its index rose from 110.6 to 136.7.
Food inflation was 18.6%, below the all-items rate, suggesting that non-food costs had stronger influence on the annual inflation burden. However, the monthly picture was severe, as food prices rose by 7.8% while all-items inflation surged by 9.4%. This points to a sharp broad-based rise in living costs.
Sokoto
Sokoto was the second most expensive state for workers, with all-items inflation at 26.0%. The all-items index rose from 108.2 to 136.3.
Food inflation was even higher at 28.0%, making food the clear driver of inflation in the state. The monthly figures reinforce this, with food prices rising by 11.8% and all-items inflation increasing by 9.0%. For workers, this means the pressure was concentrated heavily on feeding costs.
Bayelsa
Bayelsa was the most expensive state, with an annual all-items inflation of 27.4%. Its all-items index rose from 107.5 in March 2025 to 137.0 in March 2026.
Food inflation was 33.3%, the highest in the list. This means food was not just a contributor but the major source of the cost-of-living shock in the state. Monthly food inflation was 5.8%, while all-items inflation rose by 8.4%, showing that non-food costs also accelerated sharply in March.
Cheapest states
Imo
Imo ranked 10th among the cheapest states, with annual all-items inflation at 12.0%. Its index rose from 121.9 in March 2025 to 136.5 in March 2026.
Food inflation was slightly higher at 12.7%, suggesting that food was a moderate driver. Monthly food inflation stood at 5.6%, while all-items inflation was 3.8%, meaning food costs were rising faster than the general basket in March.
Katsina
Katsina recorded all-items inflation of 11.9%, with the index rising from 118.0 to 132.0.
Food inflation was 7.5%, much lower than the all-items rate. This suggests that food was not the main driver of inflation in the state. However, monthly all-items inflation was 5.6%, while food rose by just 0.1%, pointing to stronger pressure from non-food items.
Ogun
Ogun ranked eighth, with all-items inflation at 11.6%. Its all-items index increased from 121.5 to 135.6.
Food inflation was 12.6%, slightly above the general rate. But month-on-month food inflation was only 0.8%, compared with 3.4% for all items. This suggests that recent inflation pressure came more from non-food items.
Kebbi
Kebbi recorded an annual all-items inflation of 11.4%, with its index rising from 122.5 to 136.5.
Food inflation was 11.3%, almost identical to the all-items rate, showing balanced pressure across food and non-food items. Monthly food inflation was 6.8%, while all-items inflation was 6.7%, indicating a sharp short-term rise in prices.
Oyo
Oyo had all-items inflation of 11.3%, with its index rising from 122.4 to 136.3.
Food inflation was only 4.9%, one of the lowest in the dataset. This means food was not the main source of annual inflation. Monthly food inflation stood at 2.2%, while all-items inflation was 2.4%, showing relatively mild short-term movement.
Edo
Edo recorded all-items inflation of 11.2%, placing it among the cheaper states by the main index. Its all-items index rose from 120.1 to 133.5.
Food inflation, however, was high at 19.4%. This means workers in Edo may still have faced serious pressure on feeding costs despite the state ranking low on the overall cost-of-living index. Monthly food inflation was 5.4%, above the all-items monthly rate of 4.0%.
Jigawa
Jigawa ranked fourth among the cheapest states, with annual all-items inflation at 10.7%. The index rose from 122.1 to 135.1.
Food inflation was 10.0%, slightly below the general rate. Monthly food inflation was 3.8%, while all-items inflation was 4.3%, suggesting that non-food items played a slightly stronger role in March.
Kaduna
Kaduna recorded all-items inflation of 10.4%, with the index rising from 124.4 to 137.3.
Food inflation stood at 10.2%, almost matching the all-items rate. Monthly food and all-items inflation both stood at 5.4%, indicating that price pressure was evenly spread across the consumption basket.
Kano
Kano was the second cheapest state, with all-items inflation at 9.9%. Its all-items index rose from 121.6 to 133.6.
Food inflation was only 4.3%, meaning food was not a major driver of the state’s annual inflation. However, monthly all-items inflation stood at 4.0%, compared with 1.6% for food, suggesting that recent pressure came largely from non-food costs.
Osun
Osun emerged as the cheapest state for workers, with annual all-items inflation of 5.3%. Its all-items index rose from 125.3 to 131.9.
Food inflation stood at 12.1%, far above the state’s all-items inflation rate. This means Osun’s low overall cost-of-living ranking was not due to cheap food alone. Food prices still increased meaningfully, but other parts of the consumption basket helped keep the overall inflation rate low. Monthly food inflation was 3.3%, while all-items inflation was 2.6%.