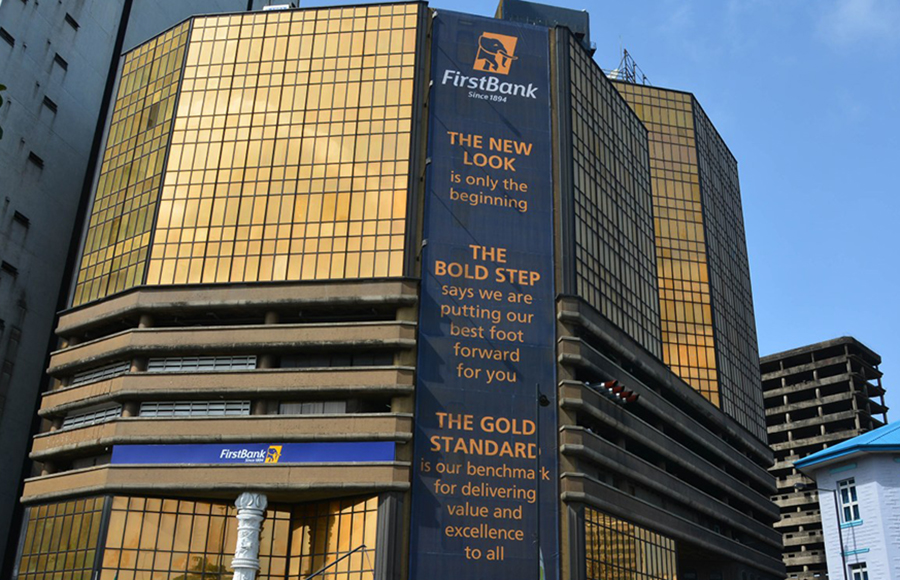
- FBNH shares soar to a 10-Year high with a significant trading volume surge.
- This positioned the bank’s shares as the second most traded stock on the NGX within the past three months, pushing up the share price’s YtD gain to 74.3%
- Evaluating the buzz, is the surge in FBNH share price justified?
At the close of trading on Thursday, July 6th, 2023, FBN Holdings Plc witnessed a remarkable milestone as its share price closed at N19 per share, reaching the highest level in over ten years.
Accompanying this surge was an impressive trading volume of 4.69 billion shares, valued at approximately N76 billion. This outstanding performance positioned FBNH as the second most traded stock on the Nigerian Stock Exchange within the past three months (from March 29 to July 6, 2023).
The significant trading activity has had a profound impact on FBNH’s year-to-date (YtD) gain, which currently stands at an impressive 74.3%. This surge in the share price represents a stark contrast to the previous year, as FBNH had experienced a YtD loss of 4.39% in 2022.


As FBN Holdings Plc’s share price experiences a continued upward trajectory, hitting a new 52-week high, the validity and sustainability of the tinkle surrounding the stock come into question.
The recent surge in FBN Holdings Plc’s (FBNH) share price can be attributed to several factors, including improved investor sentiment driven by key economic reforms such as the unification of the exchange rate and the removal of fuel subsidies.
These reforms have had a positive impact on the equity market as a whole, leading to a renewed sense of optimism. This is evident in the NGX All Share Index, which is approaching levels last seen in 2008.
The banking sector, including FBNH, has experienced significant gains as a result of these market reforms.
The market capitalization of 14 banking stocks surged by 54%, reaching a total of N4.939 trillion by the end of the first half of the year. Impressively, during the second quarter alone, the sector gained an additional N1.387 trillion. These figures indicate a notable impact of the reforms.
Apart from the market sentiment driven by policy changes, the upward trajectory of FBNH’s share price may have been influenced by the active buying of shares by one of the major shareholders. These transactions could have influenced the demand and supply dynamics of the stock, potentially contributing to the positive movement in the share price.
However, it is crucial to assess the underlying fundamentals of FBNH to determine whether the share price rally is justified.
Examining the bank’s financial performance, FBNH has demonstrated a consistent gross earnings trend. In 2022, the bank achieved a 6.32% year-on-year growth in revenues, amounting to N805 billion. This growth rate outperformed the bank’s five-year compounded annual growth rate of 6.12%.
FBNH experienced a decline in pre-tax income on a year-on-year basis, with a decrease of -5.4% in 2022, although there was a positive turnaround in Q1, indicating recovery and resilience.
Furthermore, FBNH has made notable improvements in its asset quality. The non-performing loan ratio improved to 4.0% in Q1. In 2022, the non-performing loan ratio stood at 4.3%, and in 2021, it was 6.1%. These improvements indicate FBNH’s efforts to manage credit risk and enhance the quality of its loan portfolio.
The relative valuation and financial performance of FBN Holdings Plc (FBNH) provide further valuable insights for investors.
The current trading of FBNH’s share price at earnings multiple of 4.5x, based on the trailing twelve months (TTM) earnings per share (EPS) of N4.23, suggests that the stock may be considered good value.
Comparing FBNH’s price-to-earnings (P/E) ratio to the peer average of 5.1x provides further context. A lower P/E ratio relative to the industry average may indicate that FBNH’s shares are trading at a relatively lower multiple, potentially indicating undervaluation compared to its peers.
Furthermore, FBNH’s lower price-to-sales (P/S) ratio of 0.77x and price-to-book (P/B) ratio of 0.69x compared to Zenith Bank’s P/S ratio of 1.1x and P/B ratio of 0.75x may suggest that FBNH’s stock is relatively undervalued compared to Zenith Bank. Investors seeking stocks with lower valuation multiples may find FBNH more attractive in terms of potential value.
While FBNH’s valuation metrics indicate potential value, Zenith Bank’s higher P/S and P/B ratios may imply that the market has higher growth expectations for the company compared to FBNH. Investors who believe in Zenith Bank’s growth prospects may see it as a more favourable investment option.
Regarding returns, FBNH has shown a significant year-to-date (YtD) gain of 74.3%, contrasting with the loss experienced in the previous year. Analysts have set a 12-month price target of approximately N16 per share, indicating a forecasted YtD gain of about 47%. This positive outlook reflects the market’s expectations for FBNH’s future performance.
Additionally, FBNH reported a 42.86% increase in dividends in 2022 compared to the previous year. Although EPS excluding extraordinary items declined by -10.20%, both dividends per share and EPS growth on a five-year annualized basis ranked in line with the industry average relative to its peers. Analysts anticipate an 11.00% increase in dividends for the upcoming fiscal year, further highlighting positive expectations for FBNH’s dividend distribution.
Considering these factors collectively, FBNH’s stock may offer value and growth potential for investors. However, conducting comprehensive research, considering other fundamental factors, and assessing individual investment objectives and risk tolerance is crucial before making investment decisions.


