Data from the Security and Exchange Commission (SEC) says there are 73 Mutual Funds in the country as at March 29, 2018.
The Mutual Funds are further segmented into categories such as Equity-Based Mutual Funds, Fixed Income Security Funds, Money Market Funds, Bond Funds, Mixed Funds and Real Estate Funds.
Investors in these array of funds expect periodic growth in the fund’s Net Asset Value in line with their investment goals.


Criteria for selection
In this analysis, we looked at Fund Performance between the period of December 29, 2017, and March 29, 2018, to arrive at our list of top performers.
Unlike our previous analysis where we focused on the Fund Value, this time, we preferred to use the Net Asset Value Per Share (NAVPS). We believe it is a better measure of fund performance as it adjusts for the number of units that have claim to the value of a fund. It also adjusts for potential new inflows into the fund, which could contribute to the increase of a fund’s value over time. The higher the NAVPS the better the performance of the fund.
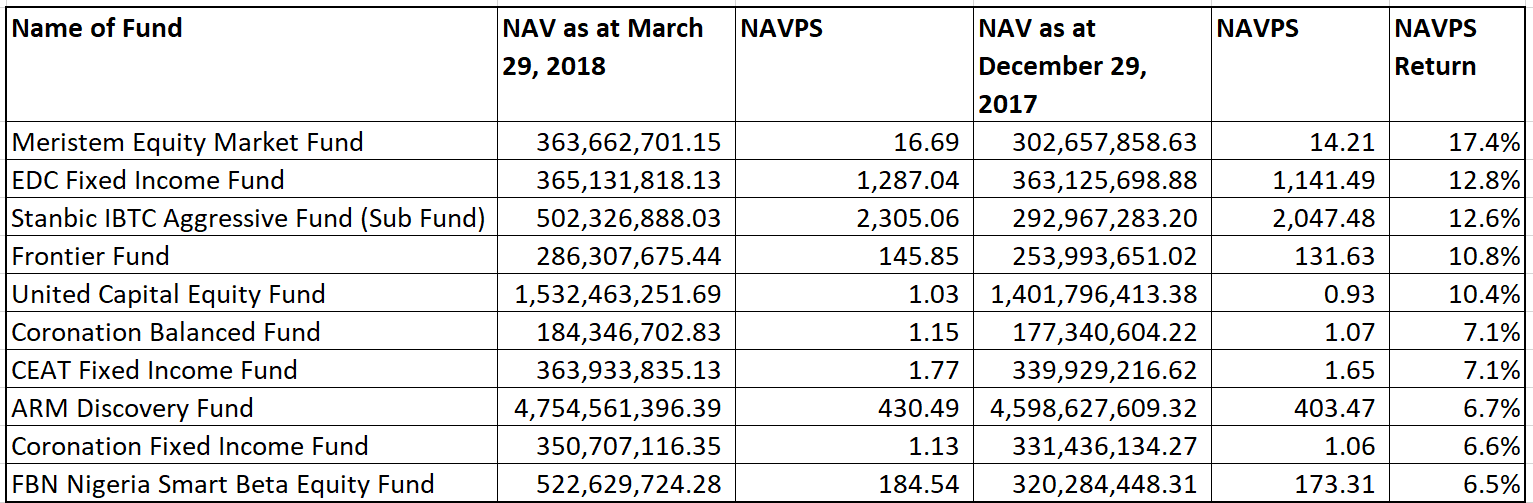
These are the top performers for the first quarter of 2018 (in ascending order)
3rd Best Performing Fund
Name of Fund – Stanbic IBTC Aggressive Fund
Who are the Fund Managers – Stanbic IBTC Asset Management
Type of Fund – Equity-Based Fund
NAV Increase – 12.6%
2nd Best Performing Fund
Name of Fund – EDC Fixed Income Fund
Who are the Fund Managers – EDC Fund Management Ltd
Type of Fund – Fixed Income Based Fund
NAV Increase – 12.8%
Best Performing Fund
Name of Fund – Meristem Equity Market Fund
Who are the Fund Managers – Meristem Wealth Management Ltd
Type of Fund – Equity-Based Fund
NAV Increase – 17.4%
See top 10 Mutual Funds as at March 29, 2018.
Get our data Spreadsheet.


Thank you for the report, its quite nice but I would like to state that this report can be misleading for an average investor who can’t perform due diligence before picking a fund to invest in. A performance based rating of funds can be quite misleading especially if they are of different asset classes. A report like this should adequately rate funds with the consideration of the other fund factors as people tend to make judgements based on information, we get from reputable blog like Nairametrics. I have tried to state two other fund factors below:
1. These reported funds are not in the same asset categories and even at that, the funds invested in the same asset class have different proportions invested i.e the meristem equity fund is a 100% equity fund, FBN Smart Beta equity has about 85% invested in equity, Coronation balanced fund is 50% equity. The implication of this is that since the stock market is doing fairly ok, the fund invested in equities would give returns with regards to their equity allocated proportions. Converse is the case if the stocks get tanked. So again, in judging performance, this should also be considered.
2. Also, investors “forget” to tell you their total expense ratios; the total cost of running those funds. Ratings based on NAVPS performance doesn’t account for this. The knowledge of a fund’s expense ratio actually matters to the average investor, for example, Coronation Merchant Bank charges 1.5% management fee and about 1% for other expenses while FBN on the other hand, charges 1.63% as their total expense ratio (management fee + other expenses). The means that if at the end of the year, both IBs realized a ytd returns of 10%, a client of coronation gets about 7.5% returns on investment while a FBN subscriber gets 8.3%. That sounds like trivial percentage on your 100 million investment yh, calculate the compound interest of your money that is being whisked away in fund fees after 40 years.
I’m not a Guru, just an average joe and I believe funds shouldn’t be rated based on their NAVPS or performance only. Don’t devour me!!
Hi Taiye thanks for your very insightful report. We do agree that fund expense ratio matter a lot when it comes to measuring fund performance however we do not have that information and SEC (where we sourced this report from) does not disclose it either. However, we will include it as a byline in the report for investors to discern appropriately.
Nevertheless, the report wanted to highlight fund performance from the point of view of an investor. To us, all a discerning investors wants to know is which fund offers the best return regardless of the structure or preferred asset class of the fund.
We also included a spreadsheet that shows each fund and their respective asset class for further reading.
Thanks a lot for the feedback and be rest assured we will include fund expense ratio once the information becomes readily available from SEC.
Cheers
Hi taiye thanks for your update on the excessive and hinding fees being charge by mutual fund companies
Thanks guys for this useful information. As stated by Taiye, Asset compositions/ allocations in an investment portfolios determine to a large extent risk/ reward or preferably investment yield. Investors risk preferences should guide decision as to which Assets class they are willing to put their hard earned money. It is expected that investor should research and ask critical questions before subscribing to any products.
Thanks Taiye. You’ve said it all.
Thanks Taiye, I think you actually nailed the point, it isn’t all about return, the cost of the return also matters. Just like comparing the sales figure of a company without looking at the cost to sales ratio.
For those who are not financially savvy and is essentially looking for a mutual fund/investment with the highest returns, would it be wrong to go with Meristem?
Like equity stock listing, where can I obtain daily listing of mutual funds in Nigeria?? Thanks
‘bakin sofidiya
Where can i obtain the mutual fund that is related to me
I’m a rookie, and need additional information about mutual funds please. Any help?