
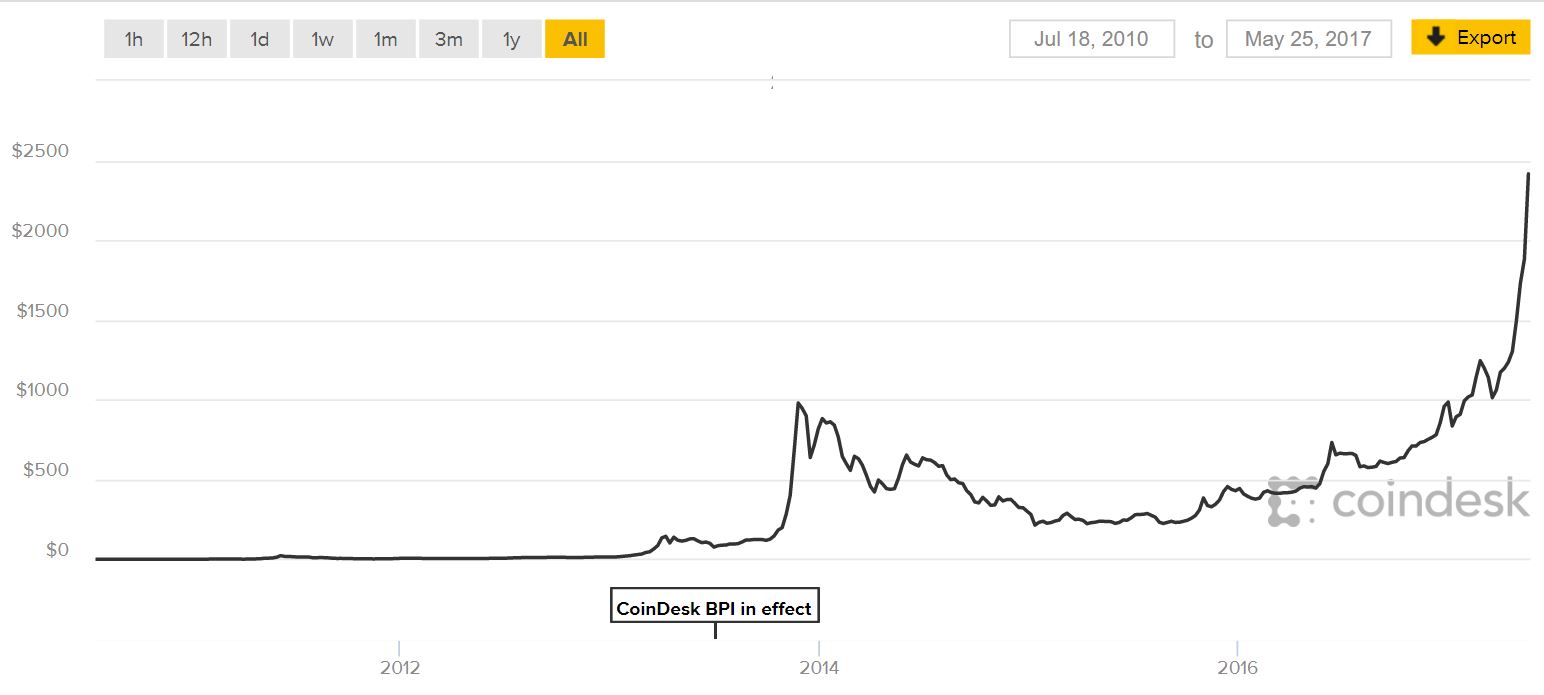
The chart above reveals the growth trajectory of bitcoin since it came into existence in 2010. Bitcoins has now returned a massive 2700% in just over 7 years. Say what you like of it but this is what the chart says. You can get the interactive chart here.
Bitcoin prices have surged since March 2017 peaking at about $2742 as at Thursday, May 25 2017. Several analysts have tried to explain why Bitcoin is surging and these are some of the reasons proffered;
- Legalization of the currency in Japan for payments
- Interest from Korea and potential adoption from more countries around the world
- The conclusion of a debate about the future of the cryptocurrency where Fifty-six companies around the world and 83 percent of bitcoin miners supported the “Bitcoin Scaling Agreement.” The document lays out an upgrade that should increase bitcoin’s transaction capacity.
- Fresh liquidity flowing into the currency from new converts as well as currency speculators
These reasons suggest Bitcoins could well hit $6000 by the end of the year according to analysts.


![[The Nigerian Economy Daily] FG has approved the closure of five foreign missions and embassies](https://nairametrics.com/wp-content/uploads/2017/05/nigerian-economy-today-1.jpg)


