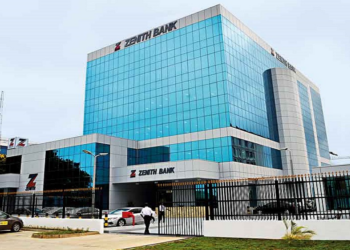
To kick start this match up is GTB vs Zenith Bank. Both companies have announced their results for 2012 and announced impressive top and bottom lines. However who do you think performed better in terms of returns for shareholders money and why did they do better. Well, see below and be the judge;
| 2012 FINANCIAL STATEMENTS | |||
| GTB | ZENITH BANK | ||
| I | PROFIT AND LOSS | N’m | N’m |
| A | REVENUE | 188,819 | 244,070 |
| B | INTEREST INCOME | 130,137 | 160,519 |
| C | INTEREST EXPENSE | 28,459 | 34,906 |
| D | FEES EARNED | 44,165 | 48,965 |
| E | FEE EXPENSE | 2,208 | |
| F | OTHER INCOME | 11,750 | 28,685 |
| G | OPERATING INCOME | 155,385 | 203,263 |
| H | STAFF COST | 20,967 | 48,168 |
| STAFF COST PER HEAD | 6 | 5 | |
| I | DIRECTOR EXPENSES | 496 | 742 |
| J | DEPRECIATION | 7,798 | 12,252 |
| K | OTHER EXPENSES (INCLUDES H-J) | 70,645 | 118,262 |
| L | LOAN LOSS EXPENSES | 19,004 | |
| M | DIMINUTION OF ASSETS | 141 | 24,303 |
| N | PROFIT BEFORE TAX (INCLUDES G-M) | 65,596 | 60,698 |
| O | TAXATION | 15,709 | 16,509 |
| P | PROFIT AFTER TAX (INCLUDES M-N) | 49,887 | 44,189 |
| II | BALANCE SHEET | ||
| ASSETS | |||
| A | LOANS & ADVANCES | 715,944 | 832,828 |
| B | TREASURY BILLS | 256,815 | 516,142 |
| C | ON-LENDING FACILITIES | – | 43,199 |
| D | INSURANCE RECEIVABLES | – | 721 |
| E | INVESTMENT SECURITIES | 109,387 | 309,459 |
| F | INVESTMENT PROPERTY | – | 7,403 |
| G | PP&E | 57,560 | 68,838 |
| H | TOTAL ASSETS | 1,611,880 | 2,309,427 |
| LIABILITIES | – | ||
| I | CUSTOMER DEPOSITS | 1,033,068 | 1,653,570 |
| J | ON-LENDING FACILITIES | – | 49,370 |
| K | BORROWINGS | 236,743 | 20,766 |
| L | OTHER LIABILITIES | 61,986 | 180,915 |
| M | RETAINED EARNINGS | 98,785 | 74,137 |
| N | TOTAL LIABILITIES (INCLUDES I-M) | 1,373,100 | 1,929,092 |
| O | NET ASSETS | 238,780 | 380,335 |
| P | ORDINARY SHARES OUTSTANDING (MILLIONS) | 29,431 | 31,396 |
| III | CASHFLOW STATEMENT | ||
| N’m | N’m | ||
| A | OPERATING CASHFLOWS | 153,950 | 43,778 |
| B | PURCHASE OF CAPEX | 19,836 | 14,866 |
| C | PURCHASE OF INTANGIBLES | 122 | 313 |
| D | FREE CASHFLOW (A-B-C) | 133,991 | 28,599 |
| E | CASH AND CASH EQUIVALENT | 607,108 | 563,718 |
| IV | KEY RATIOS | ||
| A | EARNINGS PER SHARE | 1.7 | 1.41 |
| B | NET ASSET PER SHARE | 8.1 | 12.1 |
| C | RETURN ON EQUITY | 20.9% | 11.6% |
| D | RETURN ON ASSETS | 3.09% | 1.91% |
| E | OPERATING INCOME AS A PERCENTAGE OF GROSS INCOME | 82.29% | 83.28% |
| F | STAFF COST AS A PERCENTAGE OF OPERATING INCOME | 13.49% | 23.70% |
| G | DEPRECIATION AS A PERCENTAGE OF OPERATING INCOME | 5.02% | 6.03% |
| H | OVERHEAD AS A PERCENTAGE OF OPERATING INCOME | 45.46% | 58.18% |
| I | OPERATING PROFIT AS A PERCENTAGE OF OPERATING INCOME | 42.22% | 29.86% |
| STAFF | STAFF | ||
| J | STAFF STRENGTH | 3,565 | 8,812 |


Hi Ugo. Trust you are great. We would like to contact you. What email can we reach you on? Rgds! Hauwa
Hi Hauwa, I am fine and hope you are great too! You can reach me on ugodre@resourcedat.com or ugodre@gmail.com.Tnx
Based on this results and valuations you made, am throwing in every kobo I have on GTB.
Its weird to have GTbank greater..
Am happy for this financial review,i have an account with gtb and i really enjoy their service compare to other banks though they have their own lapses and weakness but they keep to customer satisfaction so i think this is what bring their success