If there is one thing Guaranty Trust Bank is very good at, it is their remarkable ability to be very cost efficient. For several years the bank has led fellow Tier 1 banks with the lowest cost to income ratio in the industry. This lean and efficient model has made it one of the most profitable banks in Nigeria and probably the most valuable bank around. But how has it being able to achieve this cost efficient structure?
A look at GTB’s cost structure compared to three Tier 1 banks, Access, UBA and Zenith reveals an insight into how GTB was able to post strong profits despite its modest operating income. Here is how the top 4 banks performed as regards operating income (without impairment provisions).
| Bank | Operating Income N’billion |
| Access Bank | 234.8 |
| GTB | 208.7 |
| UBA | 210.2 |
| Zenith | 308.9 |
In terms of operating income GTB actually ranks last amongst its peers.


| Bank | Employees | Total Employee cost (N’b) | Cost per employee (N’m) |
| Access Bank | 3,876 | 42.3 | 10.91 |
| GTB | 5,144 | 27.5 | 5.35 |
| UBA | 12,776 | 57.4 | 4.49 |
| Zenith | 7,416 | 67.5 | 9.10 |
As the table above depicts, in terms of salaries and wages per employee, GTB pays the least at N27.5 billion. It also came second best in terms of salary per employee. Compared to Zenith Bank, GTB saved a whopping N40 billion in salary expenses during the year.
| Operating expenses excluding salaries | ||
| Bank | 2015 N’b | 2014 N’b |
| Access Bank | 91.3 | 62.6 |
| GTB | 54.9 | 53.9 |
| UBA | 71.2 | 68.4 |
| Zenith | 89.9 | 81.5 |
GTB’s operating expenses excluding salaries and amortization cost is by far the lowest among its peers. At N54.9 billion it is about 40% lower than Access Bank’s N91.3 billion, saving about N36.3 billion. By cutting salaries and other operating expenses the bank has saved over N70 billion compared to its peers.
Other operating expenses for most banks typically cover items like advertising cost, travel expenses, professional fees, auditors remuneration, security cost, printing and stationery etc. A more specific example is with Travel expenses
| Business Travels | ||
| Bank | 2015 (N’b) | 2014 (N’b) |
| Access Bank | 5.4 | 2.7 |
| GTB | 0.64 | 0.83 |
| UBA | 3.5 | 3.1 |
| Zenith | 1.8 | 1.2 |
As the table above depicts, GTB is spending far less than its peers when it comes to business travels. While Access Bank is spending over N5 billion, GTB is spending less than N1 billion and actually reduced its cost year on year. We see this same trends where the banks share similar cost lines.
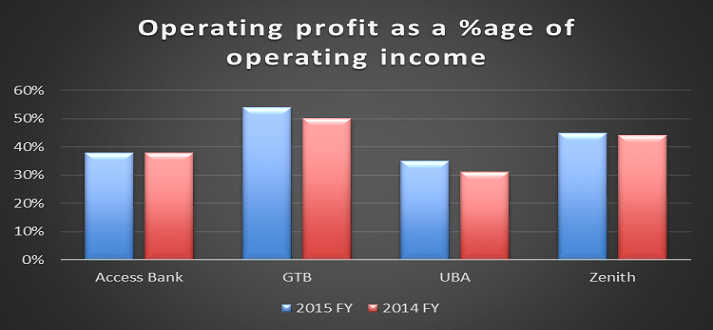
Analysts look to these numbers and wonder why banks can’t replicate GTB’s cost structure. Attempts have been made to reduce it over the years, yet we haven’t seen any of the big banks deliver a cost to income ratio that is less than 50% (GTB 46% in 2015). Should shareholders demand more at AGM’s?


GTB – doing banking right since 1990