
Lagos, 3rd November 2022 – BUA Foods Plc (“BUA Foods”, or “the Company”) announced its results for
the period ended on 30 September 2022.
Commenting on the results, Engr. Ayodele Abioye, the Managing Director said, “We continue to navigate
the high input cost environment to deliver double-digit growth within the period. We grew revenue by
20.2%, profit before tax by 16.9%, and earnings per share by 17.2%


We are making progress with the recommencement of the rice business before the year-end of 2022 to further
diversify our revenue base. In addition, we are making progress with the backward integration plans for the
sugar business and our capacity expansion plans for the flour, rice, and pasta divisions.”
Group performance and financial review
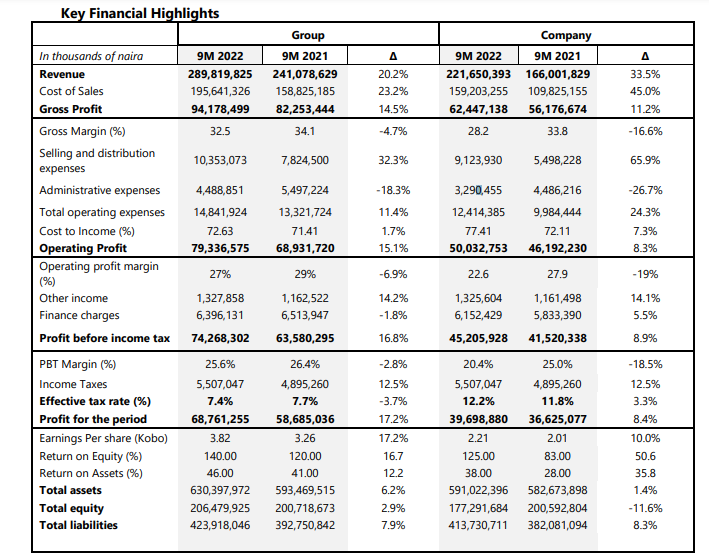
Revenue grew by 20.2% y-o-y to ₦289.8 billion in 9M 2022 (9M 2021: ₦241.1 billion). This was due to a
y-o-y increase of 17.0% in Sugar to ₦180.9 billion (9M 2021: ₦154.7 billion), 37% in Flour to ₦66.2 billion
(9M 2021: ₦48.1 billion), and 12.0% in Pasta to ₦42.7 billion (9M 2021: ₦38.2 billion).
Growth in cost of sales (+23.2%) to ₦195.6 billion in 9M 2022 (9M 2021: ₦158.8 billion) was driven by an
increase in raw materials cost (+26.7% y-o-y; 88.7% of the cost of sales). Energy costs only decline marginally
(6.2% y-o-y; 4.3% of the cost of sales). The high input cost environment and further devaluation of the Naira
against the US Dollar weighed heavily on prices for raw materials. This resulted in a higher cost of
production.
Gross profit increased by 14.5% to ₦94.2 billion in 9M 2022 (9M 2021: ₦82.2 billion) although gross profit
margin deteriorated by 160bps to 32.5% in 9M 2022 (9M 2021: 34.1%) due to the increase in input costs.
Selling and distribution expenses increase by 32.3% to ₦10.4 billion in 9M 2022 (9M 2021: ₦7.8 billion)
due to a huge increase in the cost of diesel within the period.
Administrative expenses also declined by 18.3% to ₦4.4 billion in 9M 2022 (9M 2021: ₦5.5 billion) driven
majorly by the decrease in general expenses (-61.4%) to ₦885 million in 9M 2022 (9M 2021: ₦2.2 billion)
and Maintenance & Repairs (-31.4%) to ₦723.7 million in 9M 2022 (9M 2021: ₦1.1 billion).
Total operating expenses increased by 11.4% to ₦14.8 billion in 9M 2022 (9M 2021: ₦13.3 billion)
increase in selling and distribution costs along the supply chain to customers
EBITDA increased by 2% to ₦86.4 billion in 9M 2022 (9M 2021: ₦84.6 billion), driven by growth in gross
profit. EBITDA margin deteriorated by 520bps to 29.8% in 9M 2022 (9M 2021: 35%).
Operating profit grew by 15.1% to ₦79.3 billion in 9M 2022 (9M 2021: ₦68.9 billion) benefitting from
top-line growth coupled with lower administrative expenses. Operating profit margin declined marginally
by 400bps to 27% in 9M 2022 (9M 2021: 28.0%).
Finance charges drop marginally by 1.8% to ₦6.4 billion in 9M 2022 (9M 2021: ₦6.5 billion) due to
efficient funding mix along with business transactions.
Profit before tax increased by 16.8% to ₦74.2 billion in 9M 2022 (9M 2021: ₦63.5 billion) although profit
before tax margin decline by 80bps to 25.6% in 9M 2022 (9M 2021: 26.4%) due to an increase in sales and
distribution expenses.
Profit after tax increased by 17.2% to ₦68.7 billion in 9M 2022 (9M 2021: ₦58.6 billion) benefitting from
a lower effective tax rate of 7.4% in 9M 2022 (9M 2021: 7.73%), while the Earnings per Share (EPS) grew by
17.2% to N3.83 in 9M 2022 from N3.26 in the corresponding period.
Operating segment performance
Sugar division
The Sugar division contributed 62.4% to revenue in 9M 2022 (9M 2021: 64.2%). Sugar Revenue grew by
17.0% to ₦180.9 billion in 9M 2022 (9M 2021: ₦154.7 billion). This was driven by price adjustments and
export sales within the period. Volume sold declined by 8.2% to 418,329 tons within the period (9M 2021:
453,773 tons). The decline in production is attributable to energy disruptions within the period.
Nonfortified sugar and molasses delivered good growth from elevated demand in the period. Non-fortified
sugar grew by 58.1% (53.4% of sugar sales) with revenue of ₦96.6 billion in 9M 2022 (9M 2021: ₦61.1
billion). Molasses contributed 0.4% to revenue in 9M 2022 (+99% y-o-y). Revenue from fortified (46.3%
of sugar sales) declined by 10.3% to ₦83.7 billion in 9M 2022 (9M 2021: ₦93.3 billion).
EBITDA was up by 3.6% to ₦55.1 billion in 9M 2022 (9M 2021: ₦53.2 billion). EBITDA margin was
marginally the same at 30.5% with the comparable period.
Operating profit increased by 18% to ₦51.9billion in 9M 2022 (9M 2021: ₦44billion) due to an increase in
selling price. Operating profit margin deep slightly by 30bps to 28.7% in 9M 2022 (9M 2021: 29.0%).
Profit after tax grew by 38.1% to ₦45.9 billion in 9M 2022 (9M 2021: ₦33.3 billion) while profit after tax
margin appreciated by 340bps to 25.4% in 9M 2022 (9M 2021: 22.0%).
Net Profit before Tax Margins grew to 26% from 25% achieved in the same period in 2021.
Flour division
The Flour division contributed 22.8% to revenue in 9M 2022 (9M 2021: 19.9%). Revenue increased by
38.0% to ₦66.2 billion in 9M 2022 (9M 2021: ₦48.1 billion). This was driven by adjustments in pricing as
the volume sold declined by 8% to 138,894 tons within the period (9M 2021: 151,557 tons).
The decline in production is attributable to energy challenges in Q2 2022. Revenue from bakery flour (93.8% of flour sales) increased by 40.6% to ₦62.1 billion in 9M 2022 (9M 2021: ₦44.1 billion) while wheat bran (6.2% of
flour sales) also grew marginally by 3.3% to ₦4.1 billion in 9M 2022 (9M 2021: ₦3.9 billion). The contribution margins increased to 27% from 21%for the same period last year due to higher selling prices.
EBITDA was up by 52% to ₦15.5 billion in 9M 2022 (9M 2021: ₦10.2billion). The EBITDA margin grew by
240bps to 23.6% in 9M 2022 (9M 2021: 21.2%).
Operating profit increased significantly by 87.0% to ₦13.7 billion in 9M 2022 (9M 2021: ₦7.3 billion) due
to product price adjustment. Operating profit margin improved by 560bps to 20.9% in 9M 2022 (9M 2021:
15.3%).
Profit after tax appreciated by 30.9% to ₦13.5billion in 9M 2022 (9M 2021: ₦10.3billion) while profit after
tax margin declines slightly to 20.5% in 9M 2022 (9M 2021: 21.5%).
Net Profit before Tax Margins increase to 21% from 15% for the same period last year.
Pasta division
The Pasta division contributed 14.7% to revenue in 9M 2022 (9M 2021: 15.8%). Revenue increased by 12%
to ₦42.7 billion in 9M 2022 (9M 20201 ₦38.1 billion). This was driven by adjustments in pricing as the volume
sold declined by 13.0% to 87,648 tons (9M 2021: 100,320 tons) within the period. The decline in
production is attributable to energy challenges in Q2 2022.
EBITDA dropped by 26.3% to ₦15.7billion in 9M 2022 (9M 2021: ₦21.3 billion). EBITDA margin declined to
36.8% in 9M 2022 (9M 2021: 55.9%).
Operating profit declined by 17.7% to ₦14.4billion in 9M 2022 (9M 2021: ₦17.5billion) while operating
profit margin declined by 1,230bps to 33.9% in 9M 2022 (9M 2021: 46.2%).
Profit after tax declined by 33% to ₦10.1billion in 9M 2022 (9M 2021: ₦15.0billion) while profit after tax
margin declined by 1,590bps to 23.7% in 9M 2022 (9M 2021: 39.6%).
Net Profit before Tax Margins of 34% was recorded in comparison to 46% in the same period in 2021.
Review of the statement of financial position
Total assets increased by 6.3% to ₦630.4 billion as of 9M 2022 (FY 2021: ₦593.5 billion) driven largely by
growth in trade and other receivables (+121%; 18.3% of total assets), due from related companies (-28.7%;
18.5% of total assets), and property, plant, and equipment grew marginally because of the additions to
machinery to increase capacity. The increase in cash and short-term deposits was due to advance
payment for goods.
Net cash from operating activities grew by 437.8% to ₦103.7 billion as of 9M 2022 (9M 2021: ₦23.7 billion)
due to changes in dues from related companies, changes in contract liabilities as well as inventory.
Net cash from financing activities was ₦93.7 billion in 9M 2022 (9M 2021: ₦27 billion) due to additional
proceeds from borrowings of ₦35.2 billion, repayment of borrowings of ₦67.5 billion in 9M 2022 (9M
2021: ₦31.9 billion) and finance cost paid.
Total liabilities grew by 8% to ₦423.9 billion as of 9M 2022 (FY 2021: ₦392.8 billion). This was driven
mainly by an increase in contract liabilities (+46.5%: 14.2% of total liabilities). Trade and other payables
which account for 14.7% of total liabilities increased by 61.8% to ₦62 billion as of 9M 2022 (FY 2021: ₦38.3
billion) and bank overdrafts increased by 284.1% (2.6% of total liabilities).
Total equity increased by 2.9% to ₦206.5 billion as of 9M 2022 (FY 2021: ₦200.7 billion) mainly due to a
marginal growth of 3.0% in retained earnings to ₦198.4 billion as of 9M 2022 (FY 2021: ₦192.7 billion).
Outlook
Recent environmental disruptions such as flooding impacting logistics efficiencies, energy costs, rising
input cost, coupled with rising FX concerns and the tightening stance of the Central Bank of Nigeria which
further interest rate by another 100bps to 15.5% are all core mitigating areas for us.
We expect to optimize our supply value chain as we strive to increase market share across market regions.
Furthermore, our rice division recommencement is on course as we continue to nourish lives and increase
market reach. Our retail strategy remains a priority for us in the near term, while we drive to sustain the
upward momentum of our export market strategy. We remain committed to reducing Africa’s insecurity
issues while nourishing lives.
Consolidated and separate statements of profit or loss and other comprehensive income
For the 9M period ended 30 September 2022

Definition of terms
1. Gross profit refers to revenue minus the cost of sales.
2. Gross profit margin corresponds to gross profit as a % of revenue.
3. Operating expenses correspond to Selling and distribution expenses, Administrative expenses
and Other operating expenses.
4. EBITDA refers to earnings before interest, tax, depreciation, and amortization.
5. EBITDA margin corresponds to EBITDA as a % of revenue.
6. Operating profit refers to gross profit minus operating expenses plus other operating income.
7. Operating profit margin corresponds to EBIT as a % of revenue.
8. Profit before Tax corresponds to EBIT minus net finance (cost)/income and plus share of profit
of associates and joint ventures using the equity method.
9. Profit before tax margin corresponds to profit before tax as a % of revenue.
10. Return on equity corresponds to net profit reported to average total equity.
11. Return on assets corresponds to net profit reported to average total assets.
12. Earnings per share are profit after tax from continuing operations reported to a weighted average
the number of shares.
13. The quick ratio is defined as current assets minus inventories reported to current liabilities.
14. The current ratio is defined as current assets reported to current liabilities.


