Analysts at the Standard Bank Group released an interesting analysis that pitted Nigerian Banks against Kenyan Banks. An East versus West comparison of which country’s bank faired the best at efficiency, returns on equity and market share.
The results were interesting and we will just dive straight into it.
The Parameters
We set out a performance league table for our SSA banks coverage, with a focus on the top five banks in Kenya and Nigeria. We have evaluated profitability, efficiency and market dominance. We also describe our selection criteria for each market following the release of their FY17 audited results. Nigerian banks (GTB and Zenith) outperform on ROE ranking, Kenyan banks outperform on efficiencies, while market share dominance (based on assets, loans and deposits) for the top five banks in relatively similar. The results reiterate our top picks within the two markets (GTB, Zenith, Equity and KCB) with a preference for Nigerian banks over Kenyan banks for now as we wait for a review of the interest rate cap in Kenya.
On Return on Equity


GTB, Zenith, Equity and KCB top our coverage based on ROEs. We believe that the higher interest rate environment in Nigeria and derivative gains have been key drivers of profitability in the country. Within our coverage, Guaranty Trust Bank (GTB) outperforms on both ROE and ROA. For Kenya, we attribute the lower ROE profile to NIM compression from 2016 as a result of interest rate caps introduced in September 2016.
On the largest share of the market
Top five banks dominate above 50% market share in assets, loans and deposits. Our analysis shows that the Kenyan and Nigerian banking sectors are reasonably concentrated with the top five banks in both markets accounting for c.65% and 53% of sector assets respectively (2017 latest available figures). Furthermore, the top five Nigerian banks dominate in loans and deposits (60% deposits, 58% loans) market share, far more than the Kenyan banks (54% deposits, 55% loans). In Nigeria, Zenith Bank dominates with a market share of 17%, while KCB is the dominant bank in Kenya with a market share of 16%. Within the top five, GTB has the lowest market share in Nigeria at 10% while BBK has the lowest in Kenya at 7%.
The Most Efficient Bank
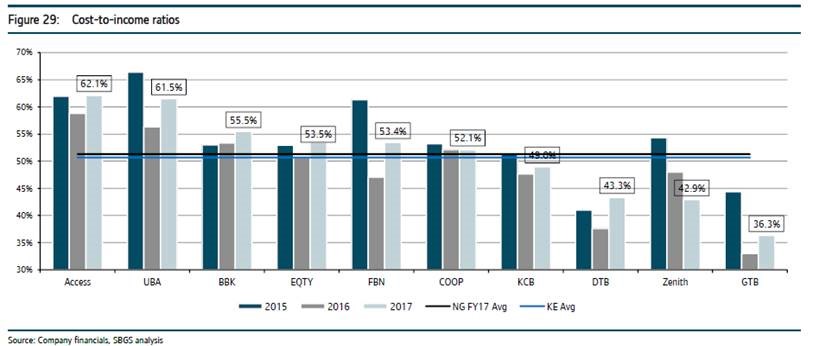
On average Kenyan banks have been more efficient than Nigerian banks. GTB, Zenith and DTB are top in efficiency with cost-to-income ratios of 36%, 43% and 43% respectively. On a regional basis, the Kenyan banks had a lower cost to-income ratio at 50.7% vs. 51.3% for the Nigerian banks in 2017. On a company level, however, the differences are quite notable. GTB is the most efficient bank in our coverage with an average (FY15 – FY17) cost-to-income ratio of 38% followed by DTB with an average of 41%. We note that for both banks staff costs contributed less than 40% of total costs in FY17.
On Non-Interest Margin
Rate caps crimp Kenyan banks’ NIMs. The interest rate cap continues to limit NIMs for the Kenyan banks where NIMs have declined by 100 bps since 2015 down to 8.35% for our top five banks. In contrast, Nigerian banks’ average NIMs improved from 7.41% in 2015 to 8.54% in 2017. Nigeria’s GTB Bank leads our ranking table with a NIM of 11.6% for FY17 while Access lags the group with a NIM of 5.8%. We believe that any rate cap reform that supports SME credit extension will be materially positive for our coverage names in Kenya.
On Total Assets
The Kenyan and Nigerian banks are reasonably concentrated with the top five banks in both markets accounting for c.65% and 53% of sector assets respectively. One caveat for our analysis is that we use October 2017 sector total assets figures for Kenyan banks and July 2017 figures for Nigerian banks. The assets of the Kenyan banking sector stood at USD40bn vs. USD101bn for the Nigerian banking sector.
Customer deposits
Concentration of deposits is also high at 54% for Kenyan banks but higher with Nigerian banks at 60%. Deposit market share has been declining for the top five banks in Nigeria from 68% in 2015. We attribute this to increased liquidity tightening in Nigeria, which has resulted in higher competition for deposits in the sector. In Kenya, market share of deposits for the top five banks has remained reasonably constant, if we include the next five banks we note an increase in market share by c.300 bps.
We attribute this deposits movement to ‘flight to quality’ experienced post the collapse of three banks in the Kenyan market starting in early 2015. We maintain that deposit concentration in a capped rate environment would be negative for system-wide credit growth, as the banks benefiting from increased liquidity would be unlikely to originate loans when yields on treasuries offer better risk-adjusted returns.
Low-cost deposits concentration in both markets
Below we show the deposit mix of the sector by type and by segment. Low-cost current and savings accounts are drivers of deposits for these banks with a higher concentration of retail and SME deposits. Retail and SME customers are less price sensitive hence the higher demand for such deposits. We see this reflected in funding costs.
Non-Performing Loans
We note asset quality deterioration in both markets. In Nigeria, NPL ratios moved from an average of 5.4% in 2015 to 8.3% in 2017. In Kenya, NPL ratios moved from 4.0% to 7.5% in 2017.
While FBN has had the most notable asset quality issues over the past three years, we note the improvement in NPL ratio in FY17 compared to FY16.
On which Bank’s stock to buy
Our top picks remain unchanged; GTB and Zenith in Nigeria, Equity and KCB in Kenya. We continue to prefer GTB (BUY TP N57) based on the bank’s sustainable efficiency model and growth in customers, which we expect to drive sustainable customer business in 2018e. Among the Kenyan banks we prefer Equity (BUY TP Ksh54) due to its relatively superior earnings growth profile over the next 2 years driven by renewed credit appetite supported by improved business sentiment.
Get the full report below;


When you compare Nigeria to Kenya,you must take into consideration,nigeria population,the number of various tribe,the land mass,the GNP,you are mentioning about the new generation bank.e.g zenith,have you compared Nigerian bank conservative banks.e.g first bank,union bank and UBA,when you do so, i believe you,you’re picking stats to suits your prejudices.the choice is yours or not ?