It is true that governments all over the world continually argue for and indeed deploy public expenditure to put their GDP on a desired trajectory in what is called aggregate demand management. It is no shame that the Buhari administration borrowed and spent massively in order to achieve its GDP target, grow the economic pie and create jobs. However, the major worry of citizens, businesses and investors is whether government’s budgeted expenditure is having desired impacts on GDP. In other words, what is the efficiency of government expenditure (so far)? We will try to answer this question using a simple concept called fiscal multiplier. Fiscal multiplier is a static analysis (i.e. in a particular period). This article will go on to compare the desired with actual GDP and try to explain reasons for the divergence.
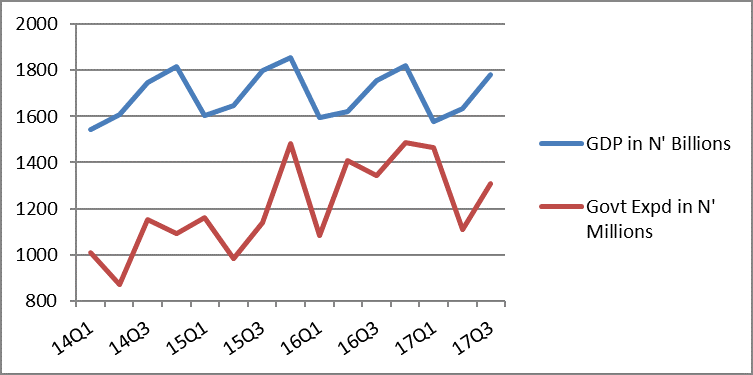
Before we investigate further, below (in Fig 1) is how the data stacks up.
The first thing one should observe is that there seems to be some sort of relationship from 2015 Q1 to 2016 Q3. However, government expenditure (red line) is very erratic (even within a budget cycle) which should not be. Before we proceed, we need to go behind the scenes to get Nigeria’s marginal consumption propensity which simply means how much kobo enters the economy from every 1 naira of spent income. We found this to be 87 kobo (0.87). Next, we need to find out how much kobo leaks out of our economy due to imports from 1 naira income spent on import. After data crunching we found this to be 52 kobo (0.52), this should have been more but has been constrained due to import controls by the CBN. These 2 result in a fiscal (expenditure) multiplier of 1.54, assuming that net taxes is zero for lack of data.
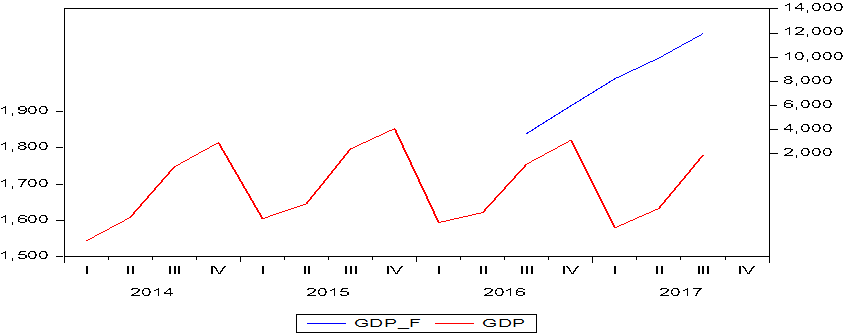
With that out of the way, we can begin to solve (in-sample forecast) for the desired or expected GDP for the Buhari administration (2016 Q3-’17 Q3) depending on the size of their quarterly budget releases. Therefore, according to our preceding analysis, the quarterly GDP forecasts are 3,690.63, 5,976.61, 8,230.34, 9,935.26 and 11,948.63 billion naira for the periods 2016 Q3 to ’17 Q3 respectively.
Note GDP_F means GDP Forecast
Fig 2 above shows the variance from 2016 Q3 which further widened from 2016 Q4 to 2017 Q3. Why? 2016 Q4 showed impact of a slump which only meant a huge loss of consumers and investors’ confidence, both important autonomous aggregate demand components. There were signs of upbeat in output at 2017 Q2 onwards which were still worlds apart from forecasts. Certainly the economy needs shots of confidence which is something the economic managers have to devise. However, for this sort of situation oftentimes, analysts are quick to site poor budget implementation or outturn for the massive variance but our analysis has shown that once monies have been spent they have to go somewhere; at least our short-run fiscal multiplier says it must show up as income to folks in the economy. Sadly, that is why some empirical findings have shown that looted treasury funds, if spent internally without finding safe havens abroad, can impact GDP positively.
In conclusion, watchers of economic forecasts from successful economies should be conversant with the work of the US president’s Council of Economic advisers (created by law). Through technical reports and research, they provide the objectives, strategies and intelligence for drafting economic management tools like the budget. Here in Nigeria, we continue to bemoan the strategy where the National Economic Council (a collection of politicians) continually show disdain for technical insights. Nigeria needs a blueprint (or institution) for enhancing budget performance efficiency, especially from the planning angle. In a future analysis, we will try to construct 2018 GDP forecast combining our knowledge of fiscal multipliers and warranted growth analysis.
Written by Enobong Udoh


