 Follow Us on Google Discover
Asset Write-Down Triggers Historic Loss
Oando Plc released its long overdue FY 2014 result as well as Q1 2015 and H1 2015 results last week Friday. We note that FY 2014 numbers are post-ConocoPhillips (COP) merger—which were consolidated from August 2014—relative to FY 2013 which is standalone. On the other hand, Oando excluded results of its downstream business from the 2015 results after reaching an agreement to sell 60% economic right to HV Investments II B.V., (“HVI”), a joint venture owned by a fund advised by Helios Investment Partners and The Vitol Group end of June 2015. Oando’s downstream business which include Oando Marketing Plc (OMP) and Oando Supply & Trading Limited (OST) account for over 80% of the company’s sales and up to 40% of EBITDA.
For FY 2014, sales dipped ~6% YoY to N424.7 billion, with a nearly 7 fold increase in administrative expenses to N271 billion driving FY 2014 loss-before-tax of N171 billion and loss-after-tax of N183 billion, relative to PBT (N0.7 million) and PAT (N1.4 billion) in 2013. For the second time in three years, Oando has not proposed a dividend. Over H1 15, although revenues rose 8% YoY to N60.3 billion, doubling of COGS and OPEX, drove loss-before-tax and loss-after-tax of N38.5 billion and N34.7 billion, respectively.
Consolidation of COP assets flatter Q4 14 topline growth
Other News
Looking at quarterly performance, Q4 14 sales rose 36.1% YoY to N86.6 billion buoyed by a four-fold increase in revenue from its upstream business, Oando Energy Resources (OER). Specifically, the consolidation of nearly 50kboed output from the acquired COP assets resulted in a six-fold increase in upstream stream revenue to N30 billion in Q4 14—~34% of group sales vs. ~8% in Q4 2013. However, with gas volumes now 50% of total upstream sales, OER’s revenue halved YoY to $34/boe in Q4 2014.
Curiously, COGS came in higher than sales at N96.8 billion (+90% YoY) causing “gross loss” of N10.4 billion in Q4 14 (vs. gross profit of N12.6 billion in Q4 13). Although available results do not provide a breakdown, we believe high production cost/boe at Oando’s upstream business, post COP consolidation, partly explains the rise. Nevertheless, we will be seeking further clarification from management at the conference call later today.
Surge in OPEX on the heels of write-down of upstream assets drive record operating loss
Worsening Q4 14 performance, operating expenses climbed fourteen fold YoY to N225 billion masking the impact of the thirty six-fold increase in “other operating income” to N60 billion. Consequently, Oando Plc posted a whopping operating loss of N175 billion in Q4 14. The rise in OPEX was largely underpinned by nearly N75 billion write-down of exploration and evaluation assets, after depressed oil prices pushed recoverable amounts on the assets below carrying amount. Importantly, Oando’s legacy assets accounted for bulk of the impairment charge (86%). Other sources of OPEX pressure include, bad debt expense (N15 billion) and COP acquisition cost (N9 billion). On the other hand, other operating income was buoyed by net gain on hedge financial instrument of nearly N50 billion (our estimate).
Table 1: Impairment charge on Oando’s upstream asset
|
Asset classification |
Exploration and evaluation assets |
Carrying amount ($ mln) |
Recoverable Amount ($ mln) |
Impairment ($ mln) |
Impairment ( |
|
Legacy |
OML 134 |
253.46 |
1.23 |
(252) |
(46,158) |
|
Legacy |
OML 125 |
77.63 |
0.49 |
(77) |
(14,117) |
|
COP |
OML 131 |
42.45 |
33.78 |
(9) |
(1,585) |
|
COP |
OML 145 |
75.62 |
27.96 |
(48) |
(8,721) |
|
Legacy |
OML 122 |
13.75 |
0.00 |
(14) |
(2,516) |
|
Legacy |
OPL 321 |
0.94 |
0.00 |
(1) |
(171) |
|
Legacy |
OPL 323 |
1.01 |
0.00 |
(1) |
(185) |
|
Total |
(401) |
(73,454) |
Source: Company financial, ARM Research
Interestingly, despite the increase in average net debt over Q4 14 (+60% YoY to N382 billion) on borrowings related to the COP acquisition earlier in the year, net finance costs fell 27% YoY to N5.3 billion. Nevertheless, largely reflecting operating weakness, Q4 14 loss-before-tax (LBT) and loss-after-tax (LAT) widened to N181 billion and N189 billion, respectively.
COP assets continue to support topline growth in Q1 15
In Q1 15, sales jumped 83% YoY to N33 billion buoyed by contribution from COP assets. Given that 2015 results exclude Oando’s downstream business, we estimate that the upstream business now accounts for more than 80% of sales. However, driven by lower oil prices (-50% YoY), and gas contribution (~50% of upstream volumes), revenue/boe from its upstream business is ~70% lower YoY at $30.
Cost of sales rose much quicker than sales to N19.6 billion (+170% YoY) in Q1 15, with gross profit rising only 25% YoY to N13.5 billion. Accordingly, gross margins contracted 19pts YoY to 40.7% on significantly lower moderation in production cost/boe from its upstream business. Specifically, relative to the sharp drop in revenue per/boe, OER’s production expenses/boe is only 18% lower YoY at $15.5.
Again, spike in OPEX cost drives operating loss
Operating costs rose 4 folds YoY to N20 billion, offsetting the impact of the spike in other income to N3.3 billion (Q1 14: N78 million). Consequently Oando posted N4 billion loss of from operations, relative to operating profit of N3.9 billion same period last year. Available results do not provide a break down, we believe the upswing partly reflects higher depreciation expenses from the acquired oil and gas assets and oil rigs of its energy service subsidiary.
Higher average net debt levels of N340 billion (+76% YoY) caused net finance charges to rise three-fold to N13 billion. Consequently, Oando reported LBT and LAT of N17 billion and N18.2 billion, respectively (Q1 14: PBT N2.5 billion and PAT: N105 million). We note that Oando’s net debt halved over Q1 15 to N234 billion from FY 2014 as the company used proceeds from early settlement and reset arrangements on financial commodity contracts (~N50 billion) and cash to ease debt burden.
Weak operating performance extends into Q2 15
Oando’s performance deteriorated further in Q2 15, with sales 27% lower YoY at N27.2 billion. Given that OER’s Q2 15 sales tripled YoY to N22 billion, we believe the downleg was underpinned by lower sales in its Oando Energy Services (OES) and Oando Gas & Power (OGP) subsidiaries.
Similar to Q1 15, COGS doubled to N17 billion, dragging gross profit 66% lower to N10.2 billion. Consequently, gross margins shrank 42pts YoY to 38%.
After the four-fold increase in Q1 15, OPEX rose 40% higher YoY to N15.1 billion in Q2 15. The higher OPEX combined with “other operating loss” of N5.6 billion saw Oando post loss from operations (N10.4 billion) for the third consecutive quarter, relative to N17 billion operating profit in Q2 2014.
Although average net debt in Q2 15 (N231 billion) is lower QoQ, due the loan repayment in Q1 15, YoY it is 36% higher. Consequently, net finance costs rose 71% YoY to N11.1 billion and drove a steep decline in LBT and LAT of N21.6 billion and N16.4 billion, respectively (Q2 14: PBT N27.2 billion and PAT: N26.7 billion).
N50 billion equity shores up deteriorating balance sheet…
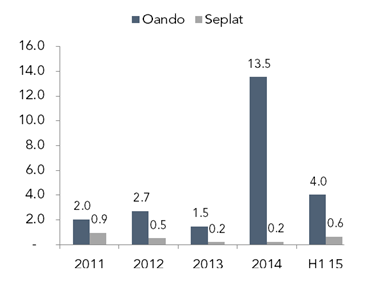
In addition to the weak operating results, Oando’s liquidity and leverage ratios deteriorated. Specifically current ratio of 0.3x is half the average in the last five years, while net debt to equity ratio hit record 13.5x by YE 2014, before easing to (a still elevated) 4x on debt reduction and additional equity. On the latter, Oando raised N50 billion via right issuance in Q2 2015 bringing total outstanding shares to 12 billion—quadruple the level as at end of Q1 13. The additional funds eased the impact of cumulative loss (N220 billion) over the last three quarters with net book value of N70 billion as at H1 15 a third of 9M 14.

Source: Company financials, ARM Research
..As derivative proceeds buoys cash flow
Furthermore, the additional equity as well as the inflow from the derivative gains (eased the cashflow pressure over H1 15. Based on our estimate free cash flow (FCF)—net operating cash less capex—of N33 billion over H1 15 is only 60% of combined interest payment (N24 billion) and scheduled principal payments (N31 billion). However, excluding the proceeds from derivatives gains, swings H1 15 FCF to negative N16 position.
Depressed oil prices to drive murky outlook
Overall, these are very poor set of numbers, with pressures on each costs item—COGS, OPEX and finance charges. In our view, depressed oil price environment has hampered the company’s ability to deliver shareholders value, with most of the cashflow used to offset debt obligations. An extension of the current oil price trajectory suggests that shareholder value will remain elusive over the coming quarters. Furthermore, after the massive impairment charge on oil and gas assets in Q4 14, the N250 billion intangible assets on Oando books—~80% is goodwill from the COP acquisition—raises red flags. Indeed, additional impairment in the coming months appear inevitable. On cashflows, whilst our estimates suggest cash flow pressures will remain in the near-term, we note that proceed ($276 million) from the sale of the downstream business ameliorates this concerns over the rest of the year. That said, we wait for management’s clarification on the results, but more importantly, the future of the company. Oando will hold its conference call on Monday 26th, October, 2015 at 4:00pm GMT.
Oando recorded negative earnings over trailing 4 quarters but trades at a P/B of 1.7x, relative to 0.5x for Seplat and 0.6x for Bloomberg’s Middle East & Africa peer average. We have a FVE of N12.99. Our estimates are under review.