NSE – 2007-2015
Nairametrics Research
In 2012 the Nigerian stock exchange put up a bold statement challenging itself that the market capitalization of the exchange will hit $1 trillion by 2016. When this statement was made, Nigerian stocks were experiencing a revival that will eventually grow the market cap of the exchange to about N14.2 trillion on the 4th of July 2014, its highest till date.
Four years after that date the exchange is going through one of the longest bearish market it has ever encountered. The Index has lost 17% this year alone and has lost over N6 trillion in market capitalization since its highs of 2014. The dream of $1 trillion market cap will surely never be a reality at least not this year.

The reasons for the market implosion we have been witnessing cannot be over emphasized. A vicious combination of the drop in oil prices, 2015 election and a slowdown of world economic growth has meant investors both foreign and local are pulling billions out of the Nigerian stock market. Despite the obvious implication of this pullout things seem different from 2009 when we last experienced a crash.
Why this is different
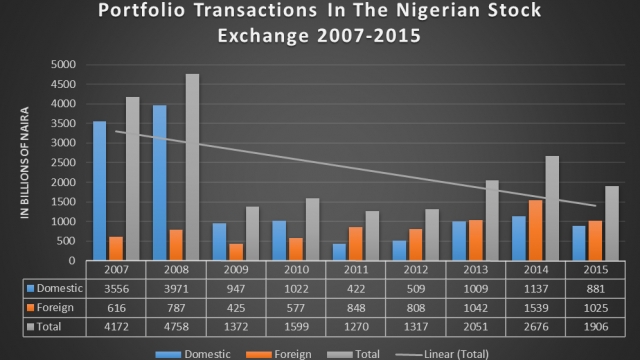
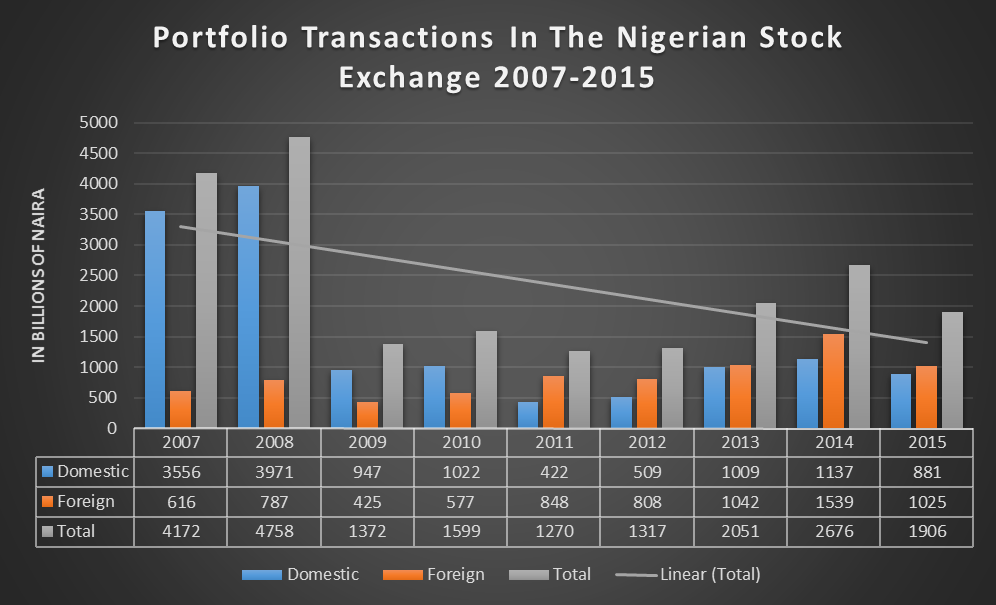
Local hot money – As the chart above (Chart 1) depicts, the period between 2006 and 2008 was characterized by a deluge of local portfolio investors. Local investors buoyed by margin lending poured in billions of naira into stocks sending the index to about 50,000 points. The huge inflow of money gave stocks deceptive valuations that they obviously did not merit. Stocks were trading at price earning multiples of over 30x and it was basically a race to the top.
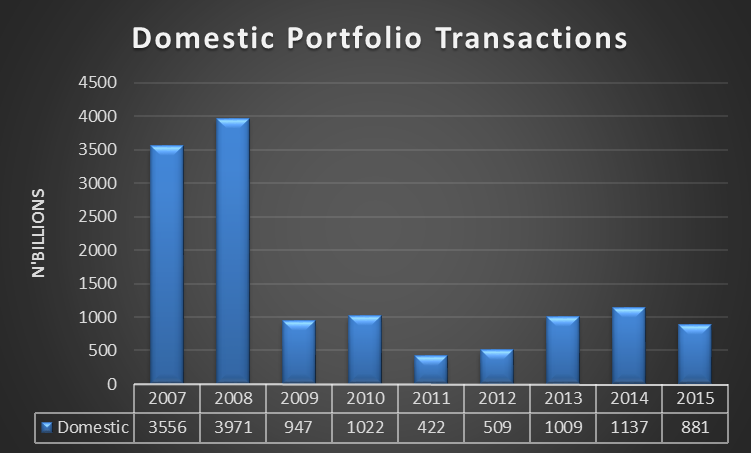
This time no such thing is happening. At the peak of the index market capitalization in 2014 local portfolio transactions (inflow and outflow) was just over N1trillion compared to over N3 trillion in 2007 and 2008. Even when combined with foreign portfolio transactions, the sum of N2.6 trillion in 2014 is still very much lower than the N3 trillion in local portfolio inflow alone. Whilst the current sell-off is huge in terms of value, the volume transactions we are seeing is still below what we experienced in 2009
FPI Leading the pack – As mentioned above, 2009 market crash was mostly triggered by influx of cheap money by local speculative investors. When the bubble bust, investors simply panicked and the rush to get out of the door will go on to crash the market. This time around, the crash is being led by foreign portfolio investors.
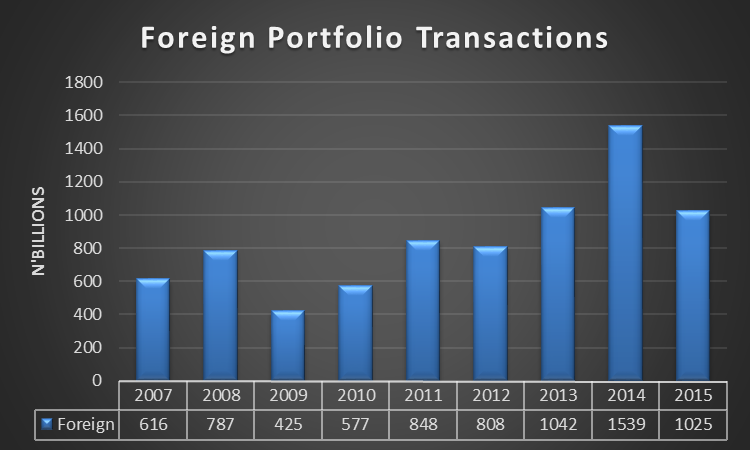
From an all time peak transaction high of N1.5 trillion in 2014, foreign portfolio transactions into Nigeria dropped by about one-third in 2015 to just over N1trillion. In fact, total outflows in 2015 was more that inflows at N554 billion and N470 billion respectively. 2014 data was N846 billion and N692 billion for outflows and inflows respectively.
Fundamentals are different – Companies on the Nigerian stock exchange have better fundamentals than they did in 2009. Yes revenues are declining and profits are being wiped out, most of the “too big to fail” companies have better financial buffers to withstand any major shocks. Banks for example are better capitalized and have enough reserves to absorb any short term losses which is likely to emanate from the state of the economy. In addition, most companies are better priced with P/E ratios even low by their standards. The Index is said to be trading at a trailing P/E ratio of about 10x. So even though, market values have dropped significantly the earnings yield available to investors who decide to buy now is attractive enough to lure in value investors.
It’s all about oil – The market turmoil we are currently experiencing is more about oil than anything else. The continued drop in the price of crude has affected Nigeria’s export earnings as well as forex inflows reverberating across the entire economy. This relationship between the drop in the price of oil and the market capitalization of the stock exchange is currently more linear than we have ever experienced.
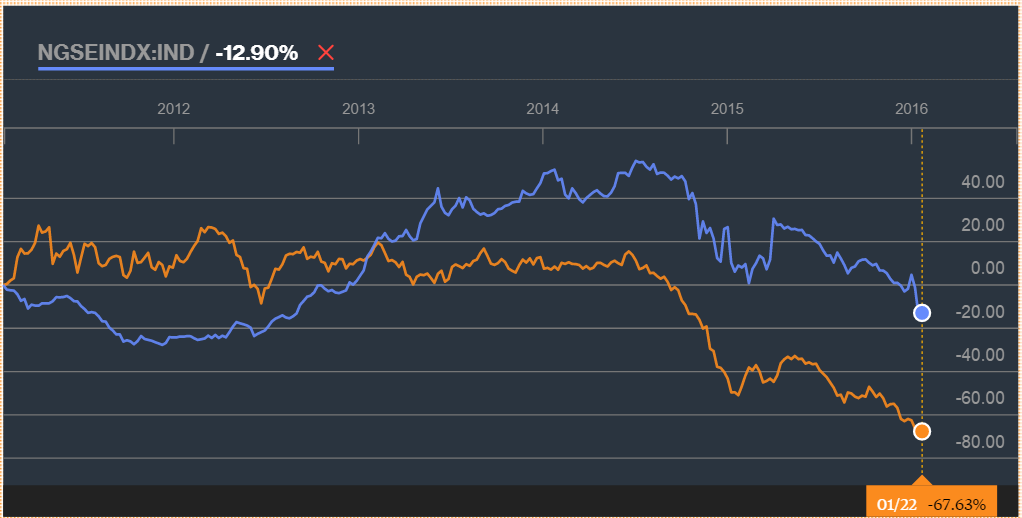
Source: Bloomberg
The higher the price of oil the more likely it is for the stock exchange to return to a bullish run. Of course, politics and insecurity still play a major role in the performance of the index but recent data shows us it is more about oil than anything else.
![[HOSTAGE] Nigerian Banks Have Idle $5billion They Can’t Sell](https://nairametrics.com/wp-content/uploads/2015/08/Nigerian-Banks-Nairametrics.png)


Much as I would like to agree with you that the slump is ‘all about oil’ l, the evidence actually points to a more fundamental culprit driver – the strong dollar (boosted by the Eurozone as it helps their manufacturing exports, as well as by the short-covering of losing speculators who shorted the dollar).