
What does a triple bottom look like? | Why is this pattern important? | Is volume important in a triple bottom? | What are the details that I should pay attention to in the triple bottom? | How can I trade this pattern? |
A triple bottom pattern displays three distinct minor lows at approximately the same price level. The triple bottom is considered to be a variation of the head and shoulders bottom. Like that pattern, the triple bottom is a reversal pattern.
What does a triple bottom look like?
As illustrated below, the triple bottom pattern is composed of three sharp lows, all at about the same price level. Prices fall to a support level, rise, fall to that support level again, rise, and finally fall, returning to the support level for a third time before beginning an upward climb. In the classic triple bottom, the upward movement in the price marks the beginning of an uptrend.
Investors should note that the three lows tend to be sharp. When prices hit the first low, sellers become scarce, believing prices have fallen too low. If a seller does agree to sell, buyers are quick to buy at a good price. Prices then bounce back up. The support level is established and the next two lows also are sharp and quick. Bulkowski points out that the sharp lows are often only one-day spikes.
While the three lows should be sharp and distinct, the highs of the pattern can appear to be rounded. The pattern is complete when prices rise about the highest high in the formation. The highest high is called the “confirmation point.”
This pattern, the experts warn, can be easily confused with other similar patterns. For example, if the center low is lower than the other two, the pattern may be a head and shoulders bottom. Also, if the three bottoms are successively higher or lower than one another, the pattern may be a triangle formation.
Because the pattern is easy to confuse, an investor should look for three sharp lows which are well separated and not part of a larger congestion pattern. In addition, between the lows, the highs should be fairly rounded in shape, although it is not absolutely necessary to the validity of the pattern. If the pattern fails to move up and break through the confirmation point after reaching the third low, the pattern is not a valid triple bottom.
Why is this pattern important?
Like the head and shoulders bottom which it so closely resembles, the triple bottom is considered to be a reliable pattern. Bulkowski estimates the failure rate to be a low 4%, assuming that an investor waits for the upside breakout through the confirmation point.
Is volume important in a triple bottom?
Generally, volume in a triple bottom tends to trend downward as the pattern forms. Volume tends to be lighter on each successive low. Volume then picks up as prices rise above the confirmation point and break into the new upward trend.
An investor should not dismiss a triple bottom if volume does not display this pattern. The pattern can take several months to form and, during that time, volume can be irregular and unpredictable. Volume should be higher at the lows than on the days leading to the lows.
What are the details that I should pay attention to in the triple bottom?
1. Duration of the Pattern
The average formation takes approximately four months to develop. The triple bottom is one of the longer patterns to develop. Schabacker and Murphy agree, however, that the longer the pattern takes to form, the greater the significance of the price move once breakout occurs.
2. Need for a Downtrend
The triple bottom is a reversal pattern. This means it is essential to the validity of the pattern that it begin with a downward trend in a stock’s price. As Yager noted above, some experts believe the downtrend must be a major one.
3. Decisive Breakout
Because a triple bottom can be confused with many other patterns as it is developing, experts advise that investors wait for a valid breakout through the confirmation point before deciding whether the pattern is a true triple bottom. Bulkowski reinforces this message, stating that true triple bottoms are quite rare and waiting for a valid breakout is essential before determining whether the pattern is a triple bottom.
4. Volume
As discussed, it is typical to see volume diminish as the pattern progresses. This should change, however, when breakout occurs. A valid breakout should be accompanied by a burst in volume. Certain experts are less concerned by seeing a steadily diminishing trend in volume as the pattern progresses through its three lows.
5. Pullback after Breakout
It is very common in the triple bottom to see a pullback after the breakout. Bulkowski estimates that 70% of triple bottoms will throw back to the breakout price.
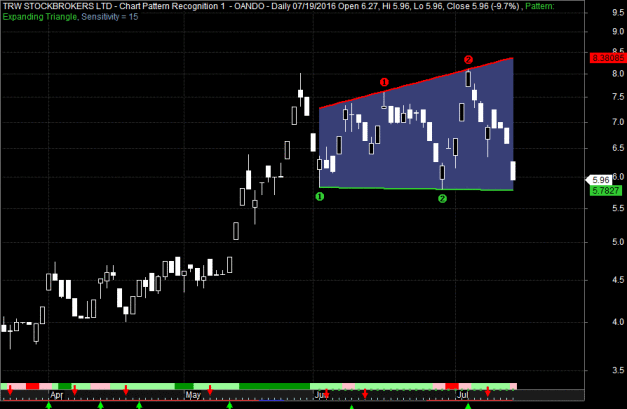
Oando Plc Daily Chart
As a technical trader, I would certainly make my final decision only after the support levels hold. For now, my charts are still telling me the same strong intermediate and short term downtrend.
- Live trading low was also broken intraday today now within the N5.44 range but isn’t significant enough to justify and conclude a technical break of the July low, (since market isnt closed yet) therefore, the March low support level is intact… at least for now.
- Well, there is a saying on wallstreet that “there is no such thing as a triple bottom”. If the double bottom formation created by the June 2nd and 29th low isn’t enough to rebound the market, a visit back down to these levels is more likely to be very bearish.
OANDO Weekly chart
- My monthly chart on Oando gives a clearer picture 2013 to 2016 Complete Head and shoulder chart pattern with major bearish breakout in late 2015 (N9.35 range)
- Below the red line an Inverse Head and shoulder pattern (BULLISH) is forming ….The left shoulder and Head pattern confirmed …But right shoulder (not confirmed yet)
- Good entry and rebound within current price to N5.00 range..
- Long-term Target breakout N9.35 levels


Look at the monthly chart. Oando is going down. Buying it now is a waste of time and money.