[visualizer id=”80703″]
| capital importation by sector | 2013 ($ Million) | 2014($ Million) | 2015 ($ Million) |
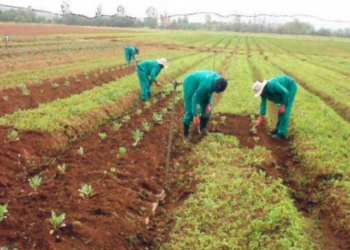
| Agriculture | 82.37 | 24.32 | 98.33 |
| Brewering | 37.37 | 0 | 9.06 |
| Construction | 47.71 | 55.69 | 28.02 |
| Consultancy | 15.31 | 26.42 | 10.59 |
| Drilling | 6.55 | 41.26 | 1.32 |
| Electrical | 10.94 | 16.02 | 212.32 |
| Fishing | 5.08 | 0.55 | 0.01 |
| I T Services | 30.38 | 9.97 | 12.78 |
| Marketing | 3.43 | 0.09 | 0.95 |
| Oil And Gas | 129.62 | 208.18 | 29.76 |
| Servicing | 630.96 | 551.31 | 200.47 |
| Hotels | 20.17 | 11.27 | 1.15 |
| Tanning | 0 | 0 | 0 |
| Trading | 280.06 | 385.61 | 167.54 |
| Transport | 0.68 | 2.47 | 10 |