
RESISTANT LEVELS TO WATCH TODAY…23 June 2016
Market ended higher in a highly technical session as the market come up against a strong technical resistance level.
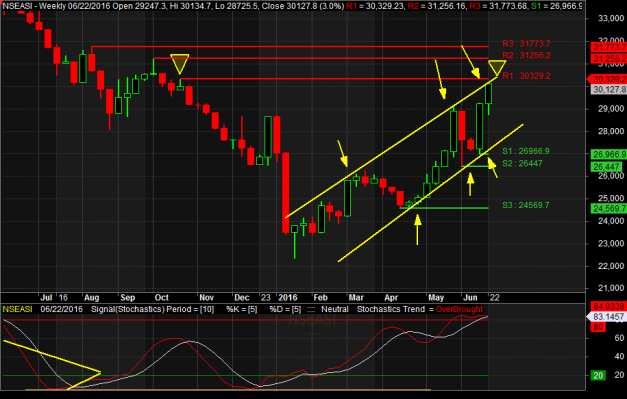
The 30,329 points close is within the October 23rd psychological resistance level (investors and traders tend to be very cautious around these numbers, but also a technical resistance within an upward price channel. What this means is that there are plenty of reasons for traders watching these levels and formations to start taking profit.
NSEASI WEEKLY CHART
GTB PLC
So far GTB is the only stock that broke its daily resistant levels at N21.00 now trending at N23.20.
Profit taking expected within the October 2015 resistance of N24-N25.00

NB PLC WEEKLY CHART
- Trending within Very strong resistance of June/October 2015 and June 2016 levels of N149/N151

ACCESS DAILY CHART
- Triple top chart resistance levels of N6.50 still intact

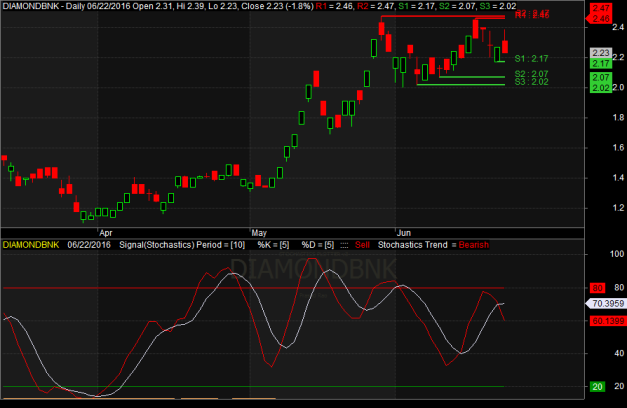
DIAMONDBANK
- N2.48 resistance remains intact with N2.17 acting as immediate support levels
FBNH
- Showing lower low Resistance levels from N4.59 to N4.53 with immediate support at N4.18

FCMB
- Watch the N1.80 and N1.87 resistance levels

FIDELITY
- Watch the N1.44 to N1.47 resistance levels

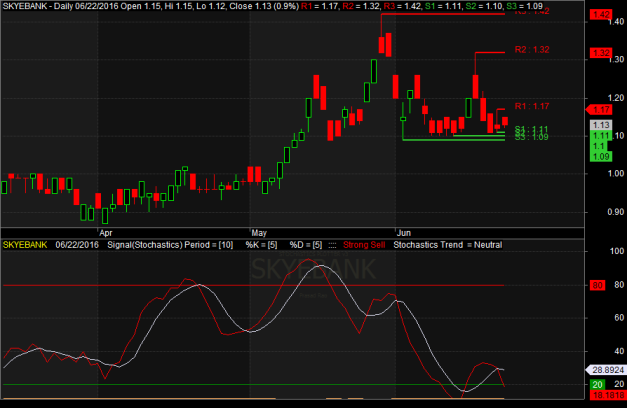
SKYEBANK
- N1.09 remains a strong support zone for skyebank
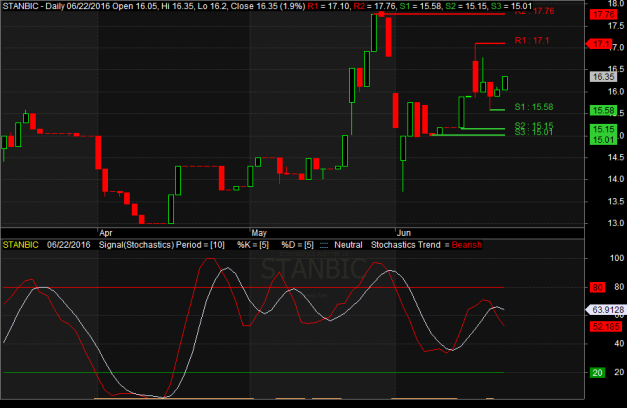
STANBIC
- Trending Lower low resistance levels from N17.76 N17.10
ETI

STERLINGBANK
- Watch the N1.65 short term resistance levels

UBA
- N5.36 remains strong resistance level

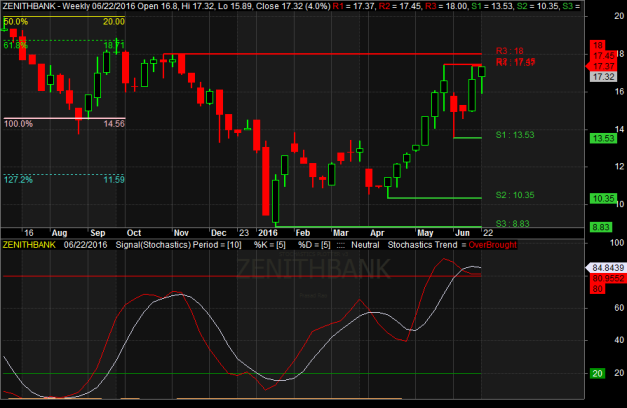
ZENITHBANK
- N17.45 resistance level intact for the period of May and June 2016
- October/November 2015 of N18.00 to be watched
The real question now is a technical one. The NSEASI is once again at its October 2015 resistance level. This is a strong resistance level which started the strong bear trend from 31,000 to 22,000 points.
Today’s trading would be critical. If the NSEASI follows up with a strong resistance level breakout, we could see a reversal into an intermediate bull trend. Lets watch and see.
HAPPY TRADING


